Immigrants from Bahamas vs Trinidadian and Tobagonian GED/Equivalency
COMPARE
Immigrants from Bahamas
Trinidadian and Tobagonian
GED/Equivalency
GED/Equivalency Comparison
Immigrants from Bahamas
Trinidadians and Tobagonians
84.2%
GED/EQUIVALENCY
2.6/ 100
METRIC RATING
239th/ 347
METRIC RANK
83.0%
GED/EQUIVALENCY
0.2/ 100
METRIC RATING
267th/ 347
METRIC RANK
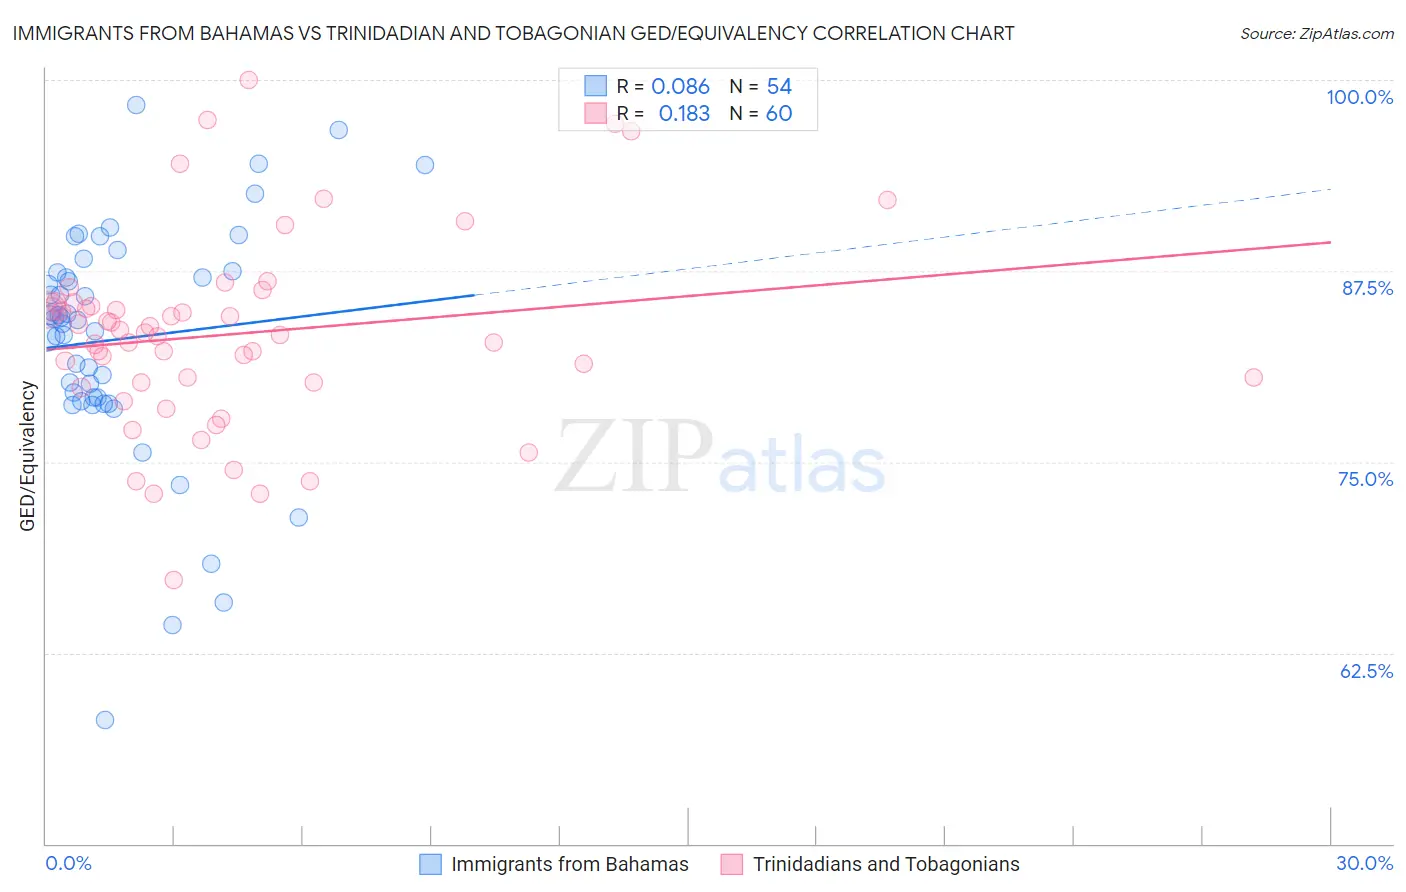
Immigrants from Bahamas vs Trinidadian and Tobagonian GED/Equivalency Correlation Chart
The statistical analysis conducted on geographies consisting of 104,666,801 people shows a slight positive correlation between the proportion of Immigrants from Bahamas and percentage of population with at least ged/equivalency education in the United States with a correlation coefficient (R) of 0.086 and weighted average of 84.2%. Similarly, the statistical analysis conducted on geographies consisting of 219,883,449 people shows a poor positive correlation between the proportion of Trinidadians and Tobagonians and percentage of population with at least ged/equivalency education in the United States with a correlation coefficient (R) of 0.183 and weighted average of 83.0%, a difference of 1.3%.
GED/Equivalency Correlation Summary
| Measurement | Immigrants from Bahamas | Trinidadian and Tobagonian |
| Minimum | 58.1% | 67.3% |
| Maximum | 98.3% | 100.0% |
| Range | 40.3% | 32.7% |
| Mean | 83.0% | 83.4% |
| Median | 84.3% | 83.4% |
| Interquartile 25% (IQ1) | 79.2% | 80.2% |
| Interquartile 75% (IQ3) | 87.4% | 85.3% |
| Interquartile Range (IQR) | 8.2% | 5.0% |
| Standard Deviation (Sample) | 7.7% | 6.3% |
| Standard Deviation (Population) | 7.7% | 6.3% |
Similar Demographics by GED/Equivalency
Demographics Similar to Immigrants from Bahamas by GED/Equivalency
In terms of ged/equivalency, the demographic groups most similar to Immigrants from Bahamas are Immigrants from South Eastern Asia (84.1%, a difference of 0.020%), Immigrants from Peru (84.2%, a difference of 0.030%), Subsaharan African (84.2%, a difference of 0.090%), Senegalese (84.0%, a difference of 0.15%), and Ghanaian (84.3%, a difference of 0.16%).
| Demographics | Rating | Rank | GED/Equivalency |
| Immigrants | South America | 4.2 /100 | #232 | Tragic 84.4% |
| Immigrants | Panama | 4.1 /100 | #233 | Tragic 84.4% |
| Immigrants | Nigeria | 3.6 /100 | #234 | Tragic 84.3% |
| Ghanaians | 3.5 /100 | #235 | Tragic 84.3% |
| Immigrants | Eritrea | 3.5 /100 | #236 | Tragic 84.3% |
| Sub-Saharan Africans | 3.0 /100 | #237 | Tragic 84.2% |
| Immigrants | Peru | 2.7 /100 | #238 | Tragic 84.2% |
| Immigrants | Bahamas | 2.6 /100 | #239 | Tragic 84.2% |
| Immigrants | South Eastern Asia | 2.5 /100 | #240 | Tragic 84.1% |
| Senegalese | 1.9 /100 | #241 | Tragic 84.0% |
| Sri Lankans | 1.9 /100 | #242 | Tragic 84.0% |
| Cherokee | 1.3 /100 | #243 | Tragic 83.9% |
| Immigrants | Ghana | 1.3 /100 | #244 | Tragic 83.9% |
| Immigrants | Senegal | 1.2 /100 | #245 | Tragic 83.8% |
| Chickasaw | 1.2 /100 | #246 | Tragic 83.8% |
Demographics Similar to Trinidadians and Tobagonians by GED/Equivalency
In terms of ged/equivalency, the demographic groups most similar to Trinidadians and Tobagonians are West Indian (83.1%, a difference of 0.020%), Kiowa (83.1%, a difference of 0.020%), Bangladeshi (83.1%, a difference of 0.030%), Immigrants from Congo (83.1%, a difference of 0.040%), and Immigrants from Burma/Myanmar (83.0%, a difference of 0.040%).
| Demographics | Rating | Rank | GED/Equivalency |
| Choctaw | 0.3 /100 | #260 | Tragic 83.1% |
| Inupiat | 0.2 /100 | #261 | Tragic 83.1% |
| Immigrants | Armenia | 0.2 /100 | #262 | Tragic 83.1% |
| Immigrants | Congo | 0.2 /100 | #263 | Tragic 83.1% |
| Bangladeshis | 0.2 /100 | #264 | Tragic 83.1% |
| West Indians | 0.2 /100 | #265 | Tragic 83.1% |
| Kiowa | 0.2 /100 | #266 | Tragic 83.1% |
| Trinidadians and Tobagonians | 0.2 /100 | #267 | Tragic 83.0% |
| Immigrants | Burma/Myanmar | 0.2 /100 | #268 | Tragic 83.0% |
| Hopi | 0.2 /100 | #269 | Tragic 83.0% |
| Immigrants | Jamaica | 0.2 /100 | #270 | Tragic 82.9% |
| U.S. Virgin Islanders | 0.2 /100 | #271 | Tragic 82.9% |
| Barbadians | 0.1 /100 | #272 | Tragic 82.9% |
| Pennsylvania Germans | 0.1 /100 | #273 | Tragic 82.9% |
| Immigrants | Trinidad and Tobago | 0.1 /100 | #274 | Tragic 82.8% |