Immigrants from Iraq vs Trinidadian and Tobagonian GED/Equivalency
COMPARE
Immigrants from Iraq
Trinidadian and Tobagonian
GED/Equivalency
GED/Equivalency Comparison
Immigrants from Iraq
Trinidadians and Tobagonians
86.1%
GED/EQUIVALENCY
68.1/ 100
METRIC RATING
162nd/ 347
METRIC RANK
83.0%
GED/EQUIVALENCY
0.2/ 100
METRIC RATING
267th/ 347
METRIC RANK
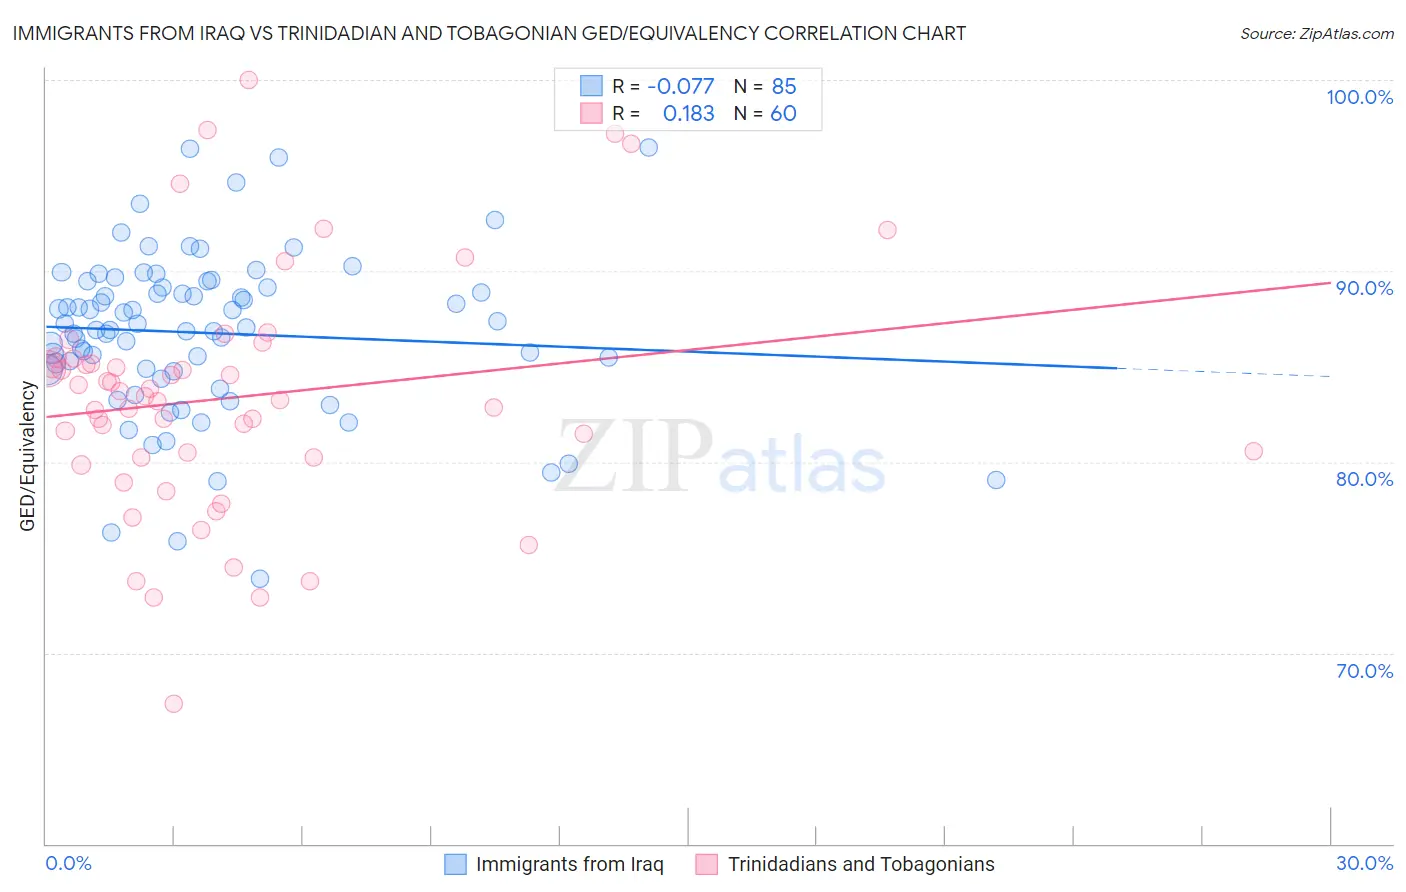
Immigrants from Iraq vs Trinidadian and Tobagonian GED/Equivalency Correlation Chart
The statistical analysis conducted on geographies consisting of 194,780,026 people shows a slight negative correlation between the proportion of Immigrants from Iraq and percentage of population with at least ged/equivalency education in the United States with a correlation coefficient (R) of -0.077 and weighted average of 86.1%. Similarly, the statistical analysis conducted on geographies consisting of 219,883,449 people shows a poor positive correlation between the proportion of Trinidadians and Tobagonians and percentage of population with at least ged/equivalency education in the United States with a correlation coefficient (R) of 0.183 and weighted average of 83.0%, a difference of 3.7%.
GED/Equivalency Correlation Summary
| Measurement | Immigrants from Iraq | Trinidadian and Tobagonian |
| Minimum | 73.9% | 67.3% |
| Maximum | 96.5% | 100.0% |
| Range | 22.6% | 32.7% |
| Mean | 86.7% | 83.4% |
| Median | 87.0% | 83.4% |
| Interquartile 25% (IQ1) | 84.8% | 80.2% |
| Interquartile 75% (IQ3) | 89.3% | 85.3% |
| Interquartile Range (IQR) | 4.5% | 5.0% |
| Standard Deviation (Sample) | 4.3% | 6.3% |
| Standard Deviation (Population) | 4.3% | 6.3% |
Similar Demographics by GED/Equivalency
Demographics Similar to Immigrants from Iraq by GED/Equivalency
In terms of ged/equivalency, the demographic groups most similar to Immigrants from Iraq are Immigrants from Morocco (86.1%, a difference of 0.030%), Immigrants from Syria (86.1%, a difference of 0.030%), Ugandan (86.1%, a difference of 0.040%), Venezuelan (86.0%, a difference of 0.060%), and Immigrants from Kenya (86.2%, a difference of 0.090%).
| Demographics | Rating | Rank | GED/Equivalency |
| Iraqis | 75.2 /100 | #155 | Good 86.2% |
| Immigrants | Nepal | 73.3 /100 | #156 | Good 86.2% |
| Whites/Caucasians | 72.2 /100 | #157 | Good 86.2% |
| German Russians | 72.1 /100 | #158 | Good 86.2% |
| Immigrants | Kenya | 71.8 /100 | #159 | Good 86.2% |
| Immigrants | Morocco | 69.5 /100 | #160 | Good 86.1% |
| Immigrants | Syria | 69.3 /100 | #161 | Good 86.1% |
| Immigrants | Iraq | 68.1 /100 | #162 | Good 86.1% |
| Ugandans | 66.3 /100 | #163 | Good 86.1% |
| Venezuelans | 65.5 /100 | #164 | Good 86.0% |
| Alsatians | 64.3 /100 | #165 | Good 86.0% |
| Immigrants | Albania | 64.2 /100 | #166 | Good 86.0% |
| Ethiopians | 63.7 /100 | #167 | Good 86.0% |
| Sierra Leoneans | 61.8 /100 | #168 | Good 86.0% |
| Immigrants | Ethiopia | 61.2 /100 | #169 | Good 86.0% |
Demographics Similar to Trinidadians and Tobagonians by GED/Equivalency
In terms of ged/equivalency, the demographic groups most similar to Trinidadians and Tobagonians are West Indian (83.1%, a difference of 0.020%), Kiowa (83.1%, a difference of 0.020%), Bangladeshi (83.1%, a difference of 0.030%), Immigrants from Congo (83.1%, a difference of 0.040%), and Immigrants from Burma/Myanmar (83.0%, a difference of 0.040%).
| Demographics | Rating | Rank | GED/Equivalency |
| Choctaw | 0.3 /100 | #260 | Tragic 83.1% |
| Inupiat | 0.2 /100 | #261 | Tragic 83.1% |
| Immigrants | Armenia | 0.2 /100 | #262 | Tragic 83.1% |
| Immigrants | Congo | 0.2 /100 | #263 | Tragic 83.1% |
| Bangladeshis | 0.2 /100 | #264 | Tragic 83.1% |
| West Indians | 0.2 /100 | #265 | Tragic 83.1% |
| Kiowa | 0.2 /100 | #266 | Tragic 83.1% |
| Trinidadians and Tobagonians | 0.2 /100 | #267 | Tragic 83.0% |
| Immigrants | Burma/Myanmar | 0.2 /100 | #268 | Tragic 83.0% |
| Hopi | 0.2 /100 | #269 | Tragic 83.0% |
| Immigrants | Jamaica | 0.2 /100 | #270 | Tragic 82.9% |
| U.S. Virgin Islanders | 0.2 /100 | #271 | Tragic 82.9% |
| Barbadians | 0.1 /100 | #272 | Tragic 82.9% |
| Pennsylvania Germans | 0.1 /100 | #273 | Tragic 82.9% |
| Immigrants | Trinidad and Tobago | 0.1 /100 | #274 | Tragic 82.8% |