Yaqui vs Immigrants from Trinidad and Tobago Bachelor's Degree
COMPARE
Yaqui
Immigrants from Trinidad and Tobago
Bachelor's Degree
Bachelor's Degree Comparison
Yaqui
Immigrants from Trinidad and Tobago
29.0%
BACHELOR'S DEGREE
0.0/ 100
METRIC RATING
318th/ 347
METRIC RANK
35.3%
BACHELOR'S DEGREE
6.0/ 100
METRIC RATING
228th/ 347
METRIC RANK
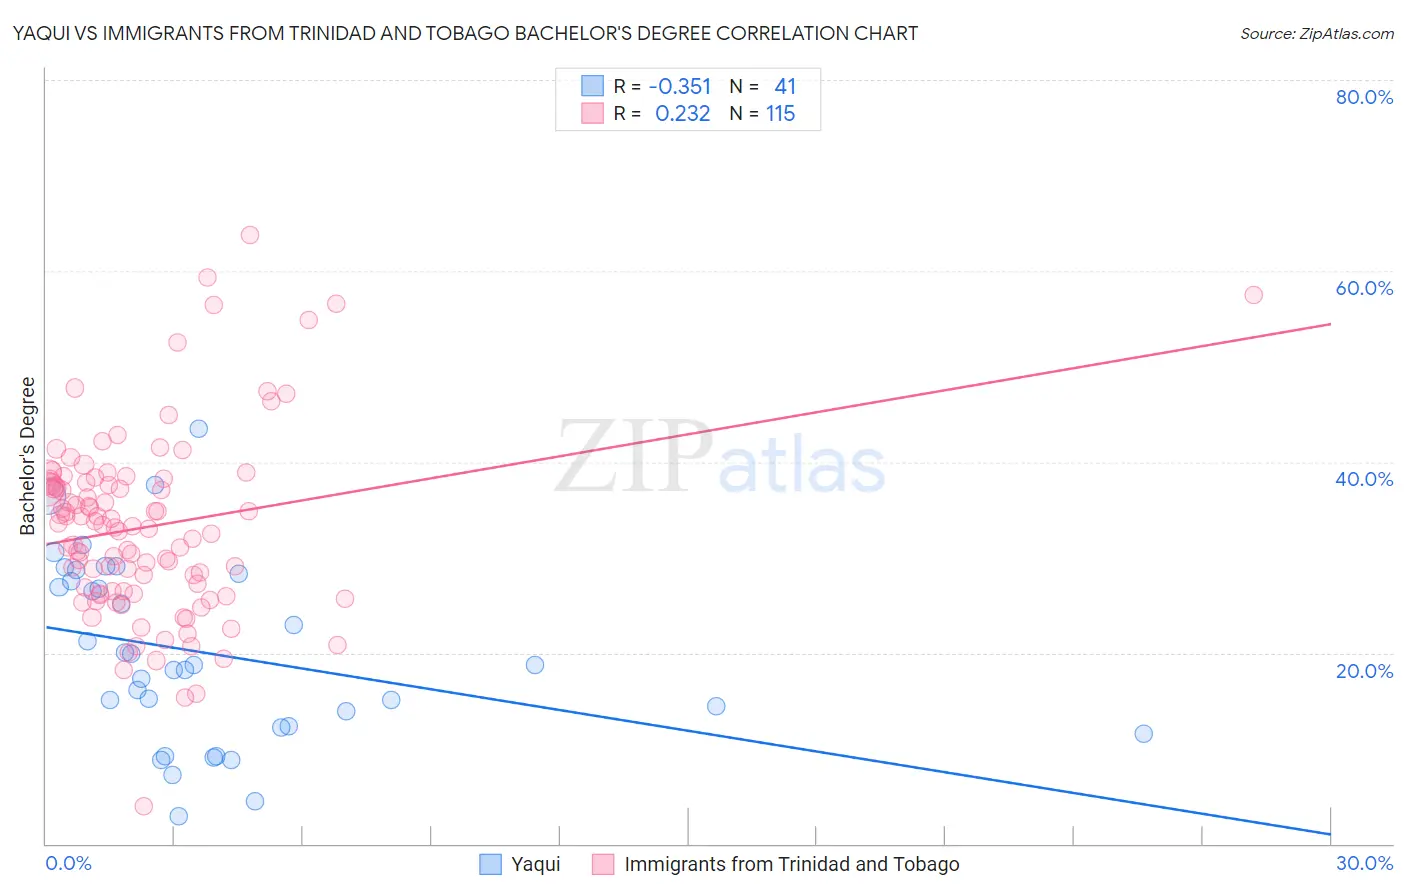
Yaqui vs Immigrants from Trinidad and Tobago Bachelor's Degree Correlation Chart
The statistical analysis conducted on geographies consisting of 107,733,965 people shows a mild negative correlation between the proportion of Yaqui and percentage of population with at least bachelor's degree education in the United States with a correlation coefficient (R) of -0.351 and weighted average of 29.0%. Similarly, the statistical analysis conducted on geographies consisting of 223,534,325 people shows a weak positive correlation between the proportion of Immigrants from Trinidad and Tobago and percentage of population with at least bachelor's degree education in the United States with a correlation coefficient (R) of 0.232 and weighted average of 35.3%, a difference of 21.8%.
Bachelor's Degree Correlation Summary
| Measurement | Yaqui | Immigrants from Trinidad and Tobago |
| Minimum | 2.9% | 4.0% |
| Maximum | 43.4% | 63.7% |
| Range | 40.5% | 59.7% |
| Mean | 19.9% | 33.2% |
| Median | 18.7% | 33.2% |
| Interquartile 25% (IQ1) | 12.3% | 26.4% |
| Interquartile 75% (IQ3) | 27.9% | 37.8% |
| Interquartile Range (IQR) | 15.6% | 11.4% |
| Standard Deviation (Sample) | 9.6% | 9.6% |
| Standard Deviation (Population) | 9.4% | 9.6% |
Similar Demographics by Bachelor's Degree
Demographics Similar to Yaqui by Bachelor's Degree
In terms of bachelor's degree, the demographic groups most similar to Yaqui are Colville (29.0%, a difference of 0.050%), Sioux (29.1%, a difference of 0.25%), Creek (28.9%, a difference of 0.45%), Kiowa (28.8%, a difference of 0.50%), and Alaskan Athabascan (28.8%, a difference of 0.58%).
| Demographics | Rating | Rank | Bachelor's Degree |
| Choctaw | 0.0 /100 | #311 | Tragic 29.4% |
| Seminole | 0.0 /100 | #312 | Tragic 29.4% |
| Alaska Natives | 0.0 /100 | #313 | Tragic 29.4% |
| Shoshone | 0.0 /100 | #314 | Tragic 29.3% |
| Immigrants | Cabo Verde | 0.0 /100 | #315 | Tragic 29.2% |
| Sioux | 0.0 /100 | #316 | Tragic 29.1% |
| Colville | 0.0 /100 | #317 | Tragic 29.0% |
| Yaqui | 0.0 /100 | #318 | Tragic 29.0% |
| Creek | 0.0 /100 | #319 | Tragic 28.9% |
| Kiowa | 0.0 /100 | #320 | Tragic 28.8% |
| Alaskan Athabascans | 0.0 /100 | #321 | Tragic 28.8% |
| Tsimshian | 0.0 /100 | #322 | Tragic 28.8% |
| Fijians | 0.0 /100 | #323 | Tragic 28.7% |
| Dutch West Indians | 0.0 /100 | #324 | Tragic 28.5% |
| Pennsylvania Germans | 0.0 /100 | #325 | Tragic 28.4% |
Demographics Similar to Immigrants from Trinidad and Tobago by Bachelor's Degree
In terms of bachelor's degree, the demographic groups most similar to Immigrants from Trinidad and Tobago are White/Caucasian (35.3%, a difference of 0.080%), Ecuadorian (35.4%, a difference of 0.23%), Portuguese (35.5%, a difference of 0.49%), Immigrants from Burma/Myanmar (35.5%, a difference of 0.53%), and Immigrants from Barbados (35.5%, a difference of 0.60%).
| Demographics | Rating | Rank | Bachelor's Degree |
| Dutch | 9.2 /100 | #221 | Tragic 35.7% |
| Trinidadians and Tobagonians | 8.8 /100 | #222 | Tragic 35.7% |
| French Canadians | 8.3 /100 | #223 | Tragic 35.6% |
| Immigrants | Barbados | 7.5 /100 | #224 | Tragic 35.5% |
| Immigrants | Burma/Myanmar | 7.3 /100 | #225 | Tragic 35.5% |
| Portuguese | 7.2 /100 | #226 | Tragic 35.5% |
| Ecuadorians | 6.6 /100 | #227 | Tragic 35.4% |
| Immigrants | Trinidad and Tobago | 6.0 /100 | #228 | Tragic 35.3% |
| Whites/Caucasians | 5.9 /100 | #229 | Tragic 35.3% |
| Immigrants | Grenada | 4.3 /100 | #230 | Tragic 35.0% |
| Immigrants | St. Vincent and the Grenadines | 4.3 /100 | #231 | Tragic 35.0% |
| Hmong | 3.4 /100 | #232 | Tragic 34.8% |
| Immigrants | Ecuador | 3.3 /100 | #233 | Tragic 34.7% |
| Guamanians/Chamorros | 3.0 /100 | #234 | Tragic 34.6% |
| Immigrants | West Indies | 2.9 /100 | #235 | Tragic 34.6% |