Immigrants from North Macedonia vs Immigrants from Trinidad and Tobago Bachelor's Degree
COMPARE
Immigrants from North Macedonia
Immigrants from Trinidad and Tobago
Bachelor's Degree
Bachelor's Degree Comparison
Immigrants from North Macedonia
Immigrants from Trinidad and Tobago
39.2%
BACHELOR'S DEGREE
81.6/ 100
METRIC RATING
142nd/ 347
METRIC RANK
35.3%
BACHELOR'S DEGREE
6.0/ 100
METRIC RATING
228th/ 347
METRIC RANK
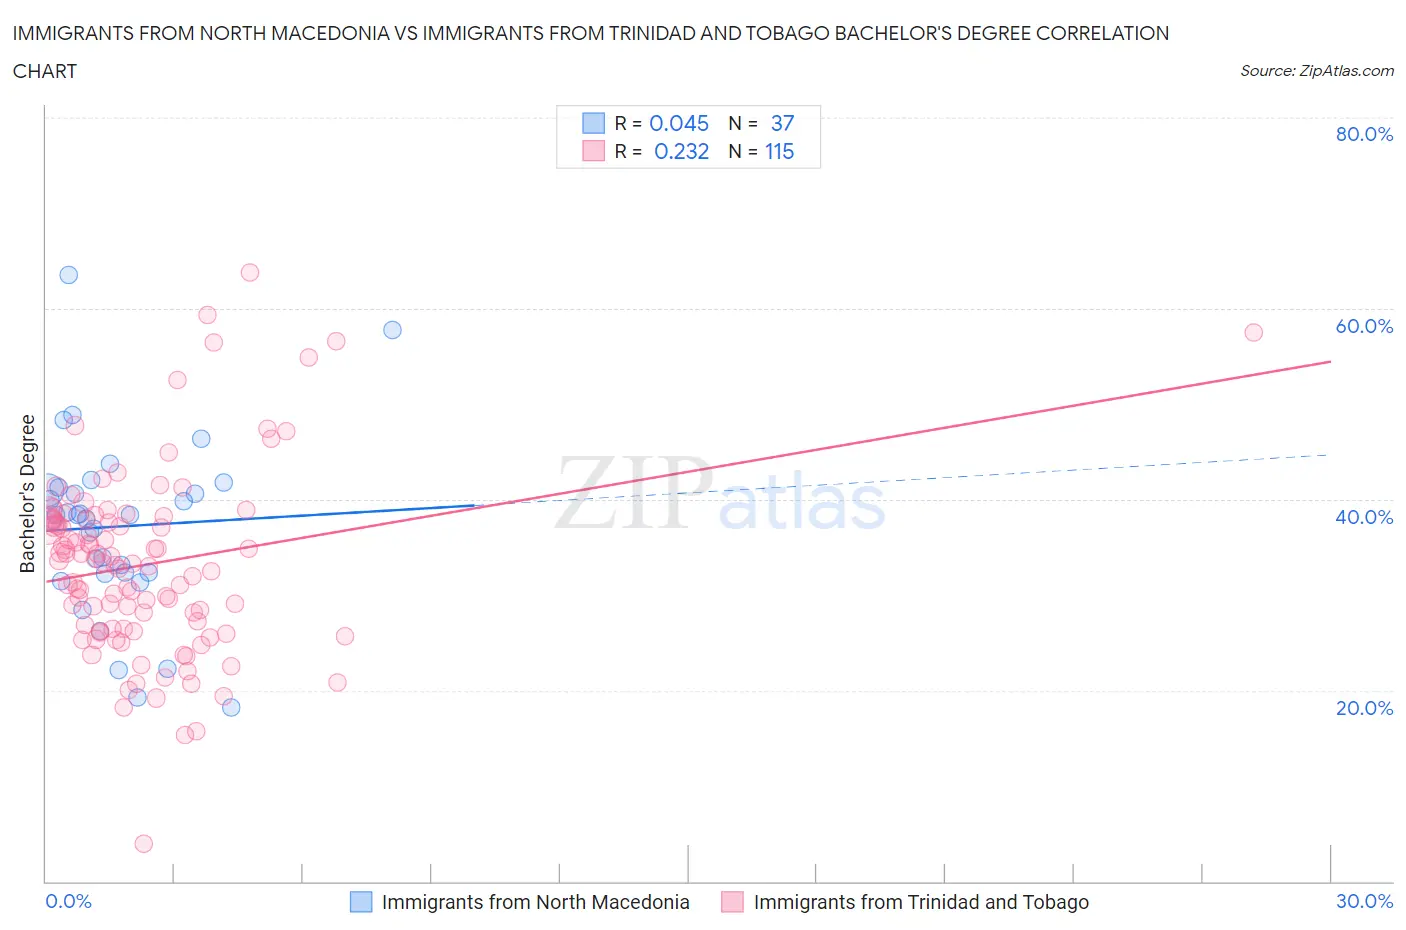
Immigrants from North Macedonia vs Immigrants from Trinidad and Tobago Bachelor's Degree Correlation Chart
The statistical analysis conducted on geographies consisting of 74,314,153 people shows no correlation between the proportion of Immigrants from North Macedonia and percentage of population with at least bachelor's degree education in the United States with a correlation coefficient (R) of 0.045 and weighted average of 39.2%. Similarly, the statistical analysis conducted on geographies consisting of 223,534,325 people shows a weak positive correlation between the proportion of Immigrants from Trinidad and Tobago and percentage of population with at least bachelor's degree education in the United States with a correlation coefficient (R) of 0.232 and weighted average of 35.3%, a difference of 11.0%.
Bachelor's Degree Correlation Summary
| Measurement | Immigrants from North Macedonia | Immigrants from Trinidad and Tobago |
| Minimum | 18.2% | 4.0% |
| Maximum | 63.5% | 63.7% |
| Range | 45.3% | 59.7% |
| Mean | 37.1% | 33.2% |
| Median | 38.3% | 33.2% |
| Interquartile 25% (IQ1) | 32.3% | 26.4% |
| Interquartile 75% (IQ3) | 41.1% | 37.8% |
| Interquartile Range (IQR) | 8.9% | 11.4% |
| Standard Deviation (Sample) | 9.3% | 9.6% |
| Standard Deviation (Population) | 9.2% | 9.6% |
Similar Demographics by Bachelor's Degree
Demographics Similar to Immigrants from North Macedonia by Bachelor's Degree
In terms of bachelor's degree, the demographic groups most similar to Immigrants from North Macedonia are Polish (39.1%, a difference of 0.27%), Immigrants from Afghanistan (39.1%, a difference of 0.29%), South American Indian (39.3%, a difference of 0.32%), Slovene (39.1%, a difference of 0.32%), and Swedish (39.1%, a difference of 0.36%).
| Demographics | Rating | Rank | Bachelor's Degree |
| Luxembourgers | 89.1 /100 | #135 | Excellent 39.8% |
| Pakistanis | 88.2 /100 | #136 | Excellent 39.7% |
| Icelanders | 86.5 /100 | #137 | Excellent 39.5% |
| Europeans | 85.6 /100 | #138 | Excellent 39.5% |
| Immigrants | Sudan | 84.5 /100 | #139 | Excellent 39.4% |
| Immigrants | Armenia | 84.1 /100 | #140 | Excellent 39.4% |
| South American Indians | 83.6 /100 | #141 | Excellent 39.3% |
| Immigrants | North Macedonia | 81.6 /100 | #142 | Excellent 39.2% |
| Poles | 79.8 /100 | #143 | Good 39.1% |
| Immigrants | Afghanistan | 79.7 /100 | #144 | Good 39.1% |
| Slovenes | 79.5 /100 | #145 | Good 39.1% |
| Swedes | 79.2 /100 | #146 | Good 39.1% |
| Immigrants | Sierra Leone | 79.0 /100 | #147 | Good 39.0% |
| Iraqis | 78.1 /100 | #148 | Good 39.0% |
| Immigrants | Poland | 77.5 /100 | #149 | Good 39.0% |
Demographics Similar to Immigrants from Trinidad and Tobago by Bachelor's Degree
In terms of bachelor's degree, the demographic groups most similar to Immigrants from Trinidad and Tobago are White/Caucasian (35.3%, a difference of 0.080%), Ecuadorian (35.4%, a difference of 0.23%), Portuguese (35.5%, a difference of 0.49%), Immigrants from Burma/Myanmar (35.5%, a difference of 0.53%), and Immigrants from Barbados (35.5%, a difference of 0.60%).
| Demographics | Rating | Rank | Bachelor's Degree |
| Dutch | 9.2 /100 | #221 | Tragic 35.7% |
| Trinidadians and Tobagonians | 8.8 /100 | #222 | Tragic 35.7% |
| French Canadians | 8.3 /100 | #223 | Tragic 35.6% |
| Immigrants | Barbados | 7.5 /100 | #224 | Tragic 35.5% |
| Immigrants | Burma/Myanmar | 7.3 /100 | #225 | Tragic 35.5% |
| Portuguese | 7.2 /100 | #226 | Tragic 35.5% |
| Ecuadorians | 6.6 /100 | #227 | Tragic 35.4% |
| Immigrants | Trinidad and Tobago | 6.0 /100 | #228 | Tragic 35.3% |
| Whites/Caucasians | 5.9 /100 | #229 | Tragic 35.3% |
| Immigrants | Grenada | 4.3 /100 | #230 | Tragic 35.0% |
| Immigrants | St. Vincent and the Grenadines | 4.3 /100 | #231 | Tragic 35.0% |
| Hmong | 3.4 /100 | #232 | Tragic 34.8% |
| Immigrants | Ecuador | 3.3 /100 | #233 | Tragic 34.7% |
| Guamanians/Chamorros | 3.0 /100 | #234 | Tragic 34.6% |
| Immigrants | West Indies | 2.9 /100 | #235 | Tragic 34.6% |