Yaqui vs Immigrants from Belgium Bachelor's Degree
COMPARE
Yaqui
Immigrants from Belgium
Bachelor's Degree
Bachelor's Degree Comparison
Yaqui
Immigrants from Belgium
29.0%
BACHELOR'S DEGREE
0.0/ 100
METRIC RATING
318th/ 347
METRIC RANK
47.0%
BACHELOR'S DEGREE
100.0/ 100
METRIC RATING
22nd/ 347
METRIC RANK
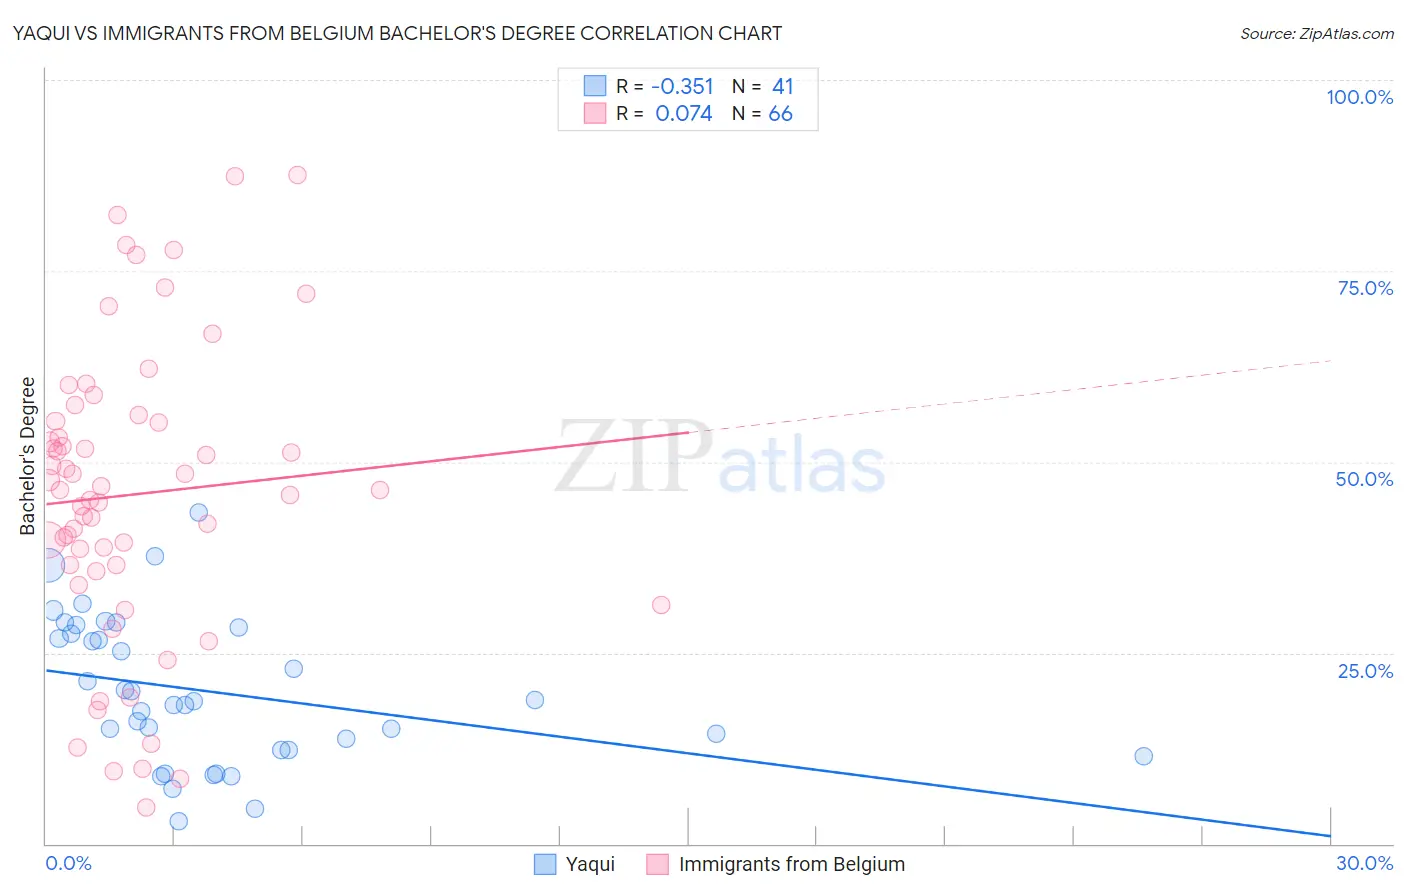
Yaqui vs Immigrants from Belgium Bachelor's Degree Correlation Chart
The statistical analysis conducted on geographies consisting of 107,733,965 people shows a mild negative correlation between the proportion of Yaqui and percentage of population with at least bachelor's degree education in the United States with a correlation coefficient (R) of -0.351 and weighted average of 29.0%. Similarly, the statistical analysis conducted on geographies consisting of 146,728,237 people shows a slight positive correlation between the proportion of Immigrants from Belgium and percentage of population with at least bachelor's degree education in the United States with a correlation coefficient (R) of 0.074 and weighted average of 47.0%, a difference of 62.3%.
Bachelor's Degree Correlation Summary
| Measurement | Yaqui | Immigrants from Belgium |
| Minimum | 2.9% | 4.8% |
| Maximum | 43.4% | 87.6% |
| Range | 40.5% | 82.8% |
| Mean | 19.9% | 45.7% |
| Median | 18.7% | 46.3% |
| Interquartile 25% (IQ1) | 12.3% | 36.5% |
| Interquartile 75% (IQ3) | 27.9% | 55.4% |
| Interquartile Range (IQR) | 15.6% | 18.9% |
| Standard Deviation (Sample) | 9.6% | 19.4% |
| Standard Deviation (Population) | 9.4% | 19.2% |
Similar Demographics by Bachelor's Degree
Demographics Similar to Yaqui by Bachelor's Degree
In terms of bachelor's degree, the demographic groups most similar to Yaqui are Colville (29.0%, a difference of 0.050%), Sioux (29.1%, a difference of 0.25%), Creek (28.9%, a difference of 0.45%), Kiowa (28.8%, a difference of 0.50%), and Alaskan Athabascan (28.8%, a difference of 0.58%).
| Demographics | Rating | Rank | Bachelor's Degree |
| Choctaw | 0.0 /100 | #311 | Tragic 29.4% |
| Seminole | 0.0 /100 | #312 | Tragic 29.4% |
| Alaska Natives | 0.0 /100 | #313 | Tragic 29.4% |
| Shoshone | 0.0 /100 | #314 | Tragic 29.3% |
| Immigrants | Cabo Verde | 0.0 /100 | #315 | Tragic 29.2% |
| Sioux | 0.0 /100 | #316 | Tragic 29.1% |
| Colville | 0.0 /100 | #317 | Tragic 29.0% |
| Yaqui | 0.0 /100 | #318 | Tragic 29.0% |
| Creek | 0.0 /100 | #319 | Tragic 28.9% |
| Kiowa | 0.0 /100 | #320 | Tragic 28.8% |
| Alaskan Athabascans | 0.0 /100 | #321 | Tragic 28.8% |
| Tsimshian | 0.0 /100 | #322 | Tragic 28.8% |
| Fijians | 0.0 /100 | #323 | Tragic 28.7% |
| Dutch West Indians | 0.0 /100 | #324 | Tragic 28.5% |
| Pennsylvania Germans | 0.0 /100 | #325 | Tragic 28.4% |
Demographics Similar to Immigrants from Belgium by Bachelor's Degree
In terms of bachelor's degree, the demographic groups most similar to Immigrants from Belgium are Immigrants from Sweden (47.0%, a difference of 0.090%), Immigrants from Korea (47.0%, a difference of 0.13%), Immigrants from Ireland (47.1%, a difference of 0.20%), Immigrants from Switzerland (47.1%, a difference of 0.21%), and Burmese (46.9%, a difference of 0.35%).
| Demographics | Rating | Rank | Bachelor's Degree |
| Immigrants | Eastern Asia | 100.0 /100 | #15 | Exceptional 48.1% |
| Soviet Union | 100.0 /100 | #16 | Exceptional 47.9% |
| Eastern Europeans | 100.0 /100 | #17 | Exceptional 47.5% |
| Indians (Asian) | 100.0 /100 | #18 | Exceptional 47.4% |
| Cambodians | 100.0 /100 | #19 | Exceptional 47.2% |
| Immigrants | Switzerland | 100.0 /100 | #20 | Exceptional 47.1% |
| Immigrants | Ireland | 100.0 /100 | #21 | Exceptional 47.1% |
| Immigrants | Belgium | 100.0 /100 | #22 | Exceptional 47.0% |
| Immigrants | Sweden | 100.0 /100 | #23 | Exceptional 47.0% |
| Immigrants | Korea | 100.0 /100 | #24 | Exceptional 47.0% |
| Burmese | 100.0 /100 | #25 | Exceptional 46.9% |
| Immigrants | Japan | 100.0 /100 | #26 | Exceptional 46.8% |
| Immigrants | France | 100.0 /100 | #27 | Exceptional 46.4% |
| Turks | 100.0 /100 | #28 | Exceptional 46.2% |
| Israelis | 100.0 /100 | #29 | Exceptional 46.1% |