Palestinian vs Immigrants from Trinidad and Tobago Bachelor's Degree
COMPARE
Palestinian
Immigrants from Trinidad and Tobago
Bachelor's Degree
Bachelor's Degree Comparison
Palestinians
Immigrants from Trinidad and Tobago
40.7%
BACHELOR'S DEGREE
95.8/ 100
METRIC RATING
115th/ 347
METRIC RANK
35.3%
BACHELOR'S DEGREE
6.0/ 100
METRIC RATING
228th/ 347
METRIC RANK
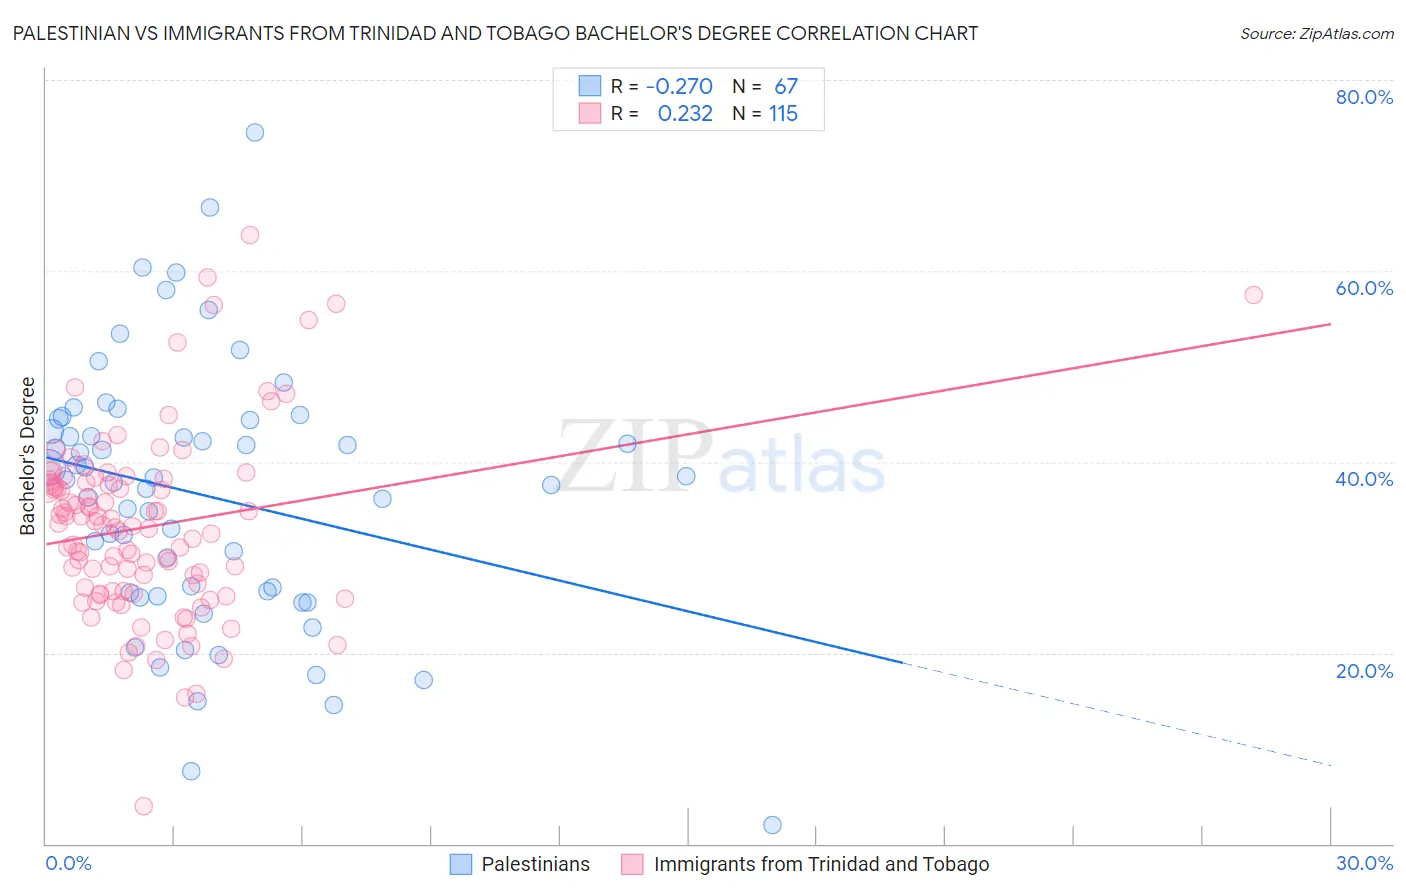
Palestinian vs Immigrants from Trinidad and Tobago Bachelor's Degree Correlation Chart
The statistical analysis conducted on geographies consisting of 216,450,003 people shows a weak negative correlation between the proportion of Palestinians and percentage of population with at least bachelor's degree education in the United States with a correlation coefficient (R) of -0.270 and weighted average of 40.7%. Similarly, the statistical analysis conducted on geographies consisting of 223,534,325 people shows a weak positive correlation between the proportion of Immigrants from Trinidad and Tobago and percentage of population with at least bachelor's degree education in the United States with a correlation coefficient (R) of 0.232 and weighted average of 35.3%, a difference of 15.3%.
Bachelor's Degree Correlation Summary
| Measurement | Palestinian | Immigrants from Trinidad and Tobago |
| Minimum | 1.9% | 4.0% |
| Maximum | 74.5% | 63.7% |
| Range | 72.6% | 59.7% |
| Mean | 36.5% | 33.2% |
| Median | 38.1% | 33.2% |
| Interquartile 25% (IQ1) | 26.3% | 26.4% |
| Interquartile 75% (IQ3) | 44.4% | 37.8% |
| Interquartile Range (IQR) | 18.1% | 11.4% |
| Standard Deviation (Sample) | 13.6% | 9.6% |
| Standard Deviation (Population) | 13.5% | 9.6% |
Similar Demographics by Bachelor's Degree
Demographics Similar to Palestinians by Bachelor's Degree
In terms of bachelor's degree, the demographic groups most similar to Palestinians are Immigrants from Uganda (40.7%, a difference of 0.050%), Austrian (40.6%, a difference of 0.15%), Croatian (40.6%, a difference of 0.17%), Afghan (40.8%, a difference of 0.24%), and Brazilian (40.8%, a difference of 0.26%).
| Demographics | Rating | Rank | Bachelor's Degree |
| Ukrainians | 96.6 /100 | #108 | Exceptional 40.9% |
| Arabs | 96.6 /100 | #109 | Exceptional 40.9% |
| Albanians | 96.5 /100 | #110 | Exceptional 40.9% |
| Immigrants | Chile | 96.4 /100 | #111 | Exceptional 40.8% |
| Ugandans | 96.3 /100 | #112 | Exceptional 40.8% |
| Brazilians | 96.3 /100 | #113 | Exceptional 40.8% |
| Afghans | 96.2 /100 | #114 | Exceptional 40.8% |
| Palestinians | 95.8 /100 | #115 | Exceptional 40.7% |
| Immigrants | Uganda | 95.7 /100 | #116 | Exceptional 40.7% |
| Austrians | 95.5 /100 | #117 | Exceptional 40.6% |
| Croatians | 95.5 /100 | #118 | Exceptional 40.6% |
| Immigrants | Syria | 94.9 /100 | #119 | Exceptional 40.5% |
| Venezuelans | 94.7 /100 | #120 | Exceptional 40.5% |
| Moroccans | 94.6 /100 | #121 | Exceptional 40.5% |
| Immigrants | Albania | 94.4 /100 | #122 | Exceptional 40.4% |
Demographics Similar to Immigrants from Trinidad and Tobago by Bachelor's Degree
In terms of bachelor's degree, the demographic groups most similar to Immigrants from Trinidad and Tobago are White/Caucasian (35.3%, a difference of 0.080%), Ecuadorian (35.4%, a difference of 0.23%), Portuguese (35.5%, a difference of 0.49%), Immigrants from Burma/Myanmar (35.5%, a difference of 0.53%), and Immigrants from Barbados (35.5%, a difference of 0.60%).
| Demographics | Rating | Rank | Bachelor's Degree |
| Dutch | 9.2 /100 | #221 | Tragic 35.7% |
| Trinidadians and Tobagonians | 8.8 /100 | #222 | Tragic 35.7% |
| French Canadians | 8.3 /100 | #223 | Tragic 35.6% |
| Immigrants | Barbados | 7.5 /100 | #224 | Tragic 35.5% |
| Immigrants | Burma/Myanmar | 7.3 /100 | #225 | Tragic 35.5% |
| Portuguese | 7.2 /100 | #226 | Tragic 35.5% |
| Ecuadorians | 6.6 /100 | #227 | Tragic 35.4% |
| Immigrants | Trinidad and Tobago | 6.0 /100 | #228 | Tragic 35.3% |
| Whites/Caucasians | 5.9 /100 | #229 | Tragic 35.3% |
| Immigrants | Grenada | 4.3 /100 | #230 | Tragic 35.0% |
| Immigrants | St. Vincent and the Grenadines | 4.3 /100 | #231 | Tragic 35.0% |
| Hmong | 3.4 /100 | #232 | Tragic 34.8% |
| Immigrants | Ecuador | 3.3 /100 | #233 | Tragic 34.7% |
| Guamanians/Chamorros | 3.0 /100 | #234 | Tragic 34.6% |
| Immigrants | West Indies | 2.9 /100 | #235 | Tragic 34.6% |