Immigrants from Australia vs Immigrants from Trinidad and Tobago Bachelor's Degree
COMPARE
Immigrants from Australia
Immigrants from Trinidad and Tobago
Bachelor's Degree
Bachelor's Degree Comparison
Immigrants from Australia
Immigrants from Trinidad and Tobago
48.5%
BACHELOR'S DEGREE
100.0/ 100
METRIC RATING
11th/ 347
METRIC RANK
35.3%
BACHELOR'S DEGREE
6.0/ 100
METRIC RATING
228th/ 347
METRIC RANK
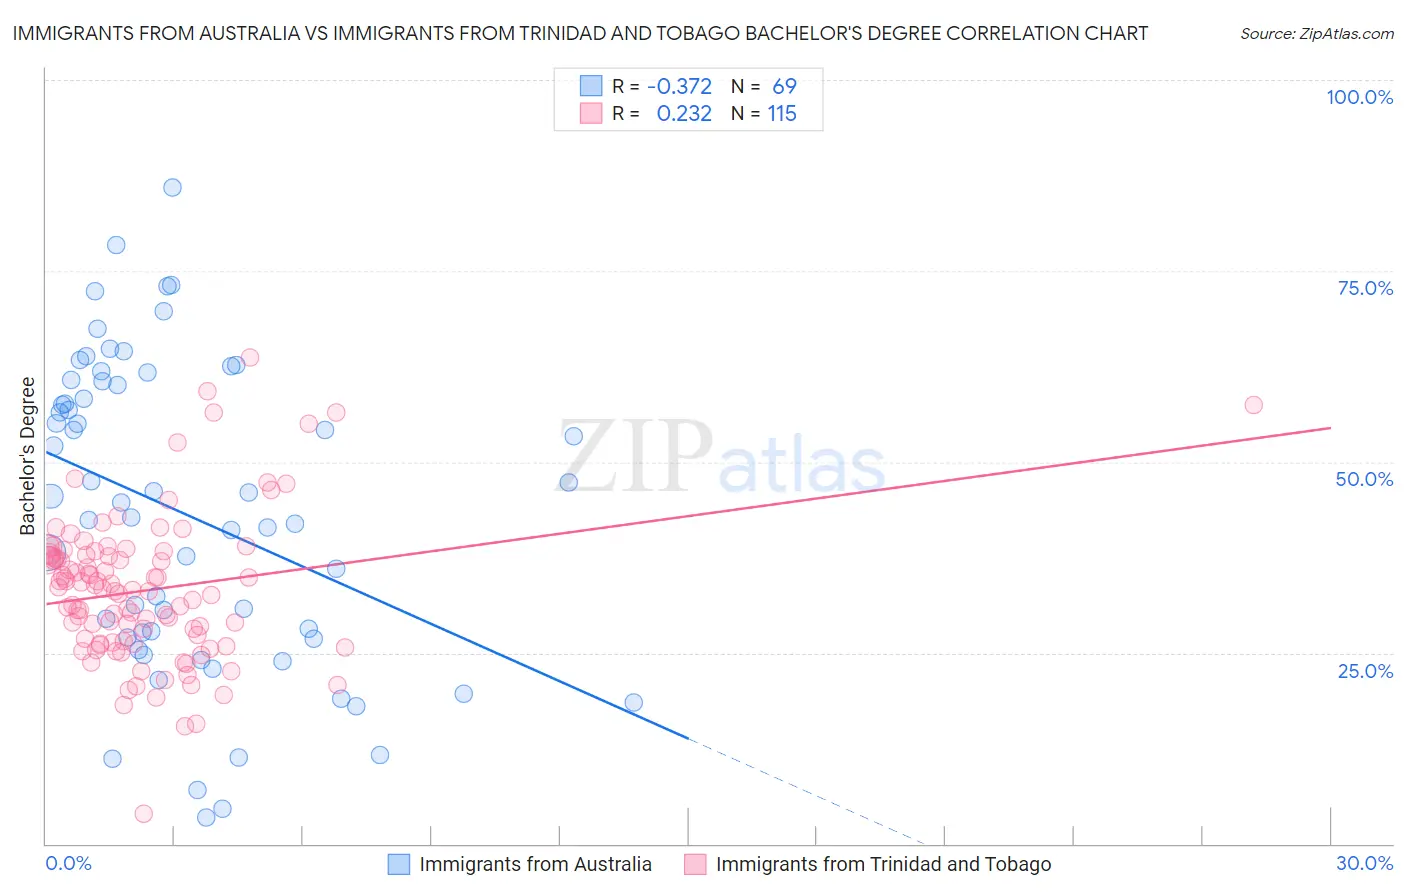
Immigrants from Australia vs Immigrants from Trinidad and Tobago Bachelor's Degree Correlation Chart
The statistical analysis conducted on geographies consisting of 227,197,750 people shows a mild negative correlation between the proportion of Immigrants from Australia and percentage of population with at least bachelor's degree education in the United States with a correlation coefficient (R) of -0.372 and weighted average of 48.5%. Similarly, the statistical analysis conducted on geographies consisting of 223,534,325 people shows a weak positive correlation between the proportion of Immigrants from Trinidad and Tobago and percentage of population with at least bachelor's degree education in the United States with a correlation coefficient (R) of 0.232 and weighted average of 35.3%, a difference of 37.4%.
Bachelor's Degree Correlation Summary
| Measurement | Immigrants from Australia | Immigrants from Trinidad and Tobago |
| Minimum | 3.4% | 4.0% |
| Maximum | 85.9% | 63.7% |
| Range | 82.5% | 59.7% |
| Mean | 43.1% | 33.2% |
| Median | 44.7% | 33.2% |
| Interquartile 25% (IQ1) | 27.0% | 26.4% |
| Interquartile 75% (IQ3) | 60.3% | 37.8% |
| Interquartile Range (IQR) | 33.3% | 11.4% |
| Standard Deviation (Sample) | 19.9% | 9.6% |
| Standard Deviation (Population) | 19.8% | 9.6% |
Similar Demographics by Bachelor's Degree
Demographics Similar to Immigrants from Australia by Bachelor's Degree
In terms of bachelor's degree, the demographic groups most similar to Immigrants from Australia are Immigrants from China (48.4%, a difference of 0.18%), Immigrants from South Central Asia (48.3%, a difference of 0.32%), Immigrants from Hong Kong (48.2%, a difference of 0.60%), Immigrants from Eastern Asia (48.1%, a difference of 0.74%), and Cypriot (49.0%, a difference of 1.1%).
| Demographics | Rating | Rank | Bachelor's Degree |
| Immigrants | Taiwan | 100.0 /100 | #4 | Exceptional 51.2% |
| Iranians | 100.0 /100 | #5 | Exceptional 51.0% |
| Okinawans | 100.0 /100 | #6 | Exceptional 50.5% |
| Immigrants | Iran | 100.0 /100 | #7 | Exceptional 50.3% |
| Thais | 100.0 /100 | #8 | Exceptional 50.1% |
| Immigrants | Israel | 100.0 /100 | #9 | Exceptional 50.0% |
| Cypriots | 100.0 /100 | #10 | Exceptional 49.0% |
| Immigrants | Australia | 100.0 /100 | #11 | Exceptional 48.5% |
| Immigrants | China | 100.0 /100 | #12 | Exceptional 48.4% |
| Immigrants | South Central Asia | 100.0 /100 | #13 | Exceptional 48.3% |
| Immigrants | Hong Kong | 100.0 /100 | #14 | Exceptional 48.2% |
| Immigrants | Eastern Asia | 100.0 /100 | #15 | Exceptional 48.1% |
| Soviet Union | 100.0 /100 | #16 | Exceptional 47.9% |
| Eastern Europeans | 100.0 /100 | #17 | Exceptional 47.5% |
| Indians (Asian) | 100.0 /100 | #18 | Exceptional 47.4% |
Demographics Similar to Immigrants from Trinidad and Tobago by Bachelor's Degree
In terms of bachelor's degree, the demographic groups most similar to Immigrants from Trinidad and Tobago are White/Caucasian (35.3%, a difference of 0.080%), Ecuadorian (35.4%, a difference of 0.23%), Portuguese (35.5%, a difference of 0.49%), Immigrants from Burma/Myanmar (35.5%, a difference of 0.53%), and Immigrants from Barbados (35.5%, a difference of 0.60%).
| Demographics | Rating | Rank | Bachelor's Degree |
| Dutch | 9.2 /100 | #221 | Tragic 35.7% |
| Trinidadians and Tobagonians | 8.8 /100 | #222 | Tragic 35.7% |
| French Canadians | 8.3 /100 | #223 | Tragic 35.6% |
| Immigrants | Barbados | 7.5 /100 | #224 | Tragic 35.5% |
| Immigrants | Burma/Myanmar | 7.3 /100 | #225 | Tragic 35.5% |
| Portuguese | 7.2 /100 | #226 | Tragic 35.5% |
| Ecuadorians | 6.6 /100 | #227 | Tragic 35.4% |
| Immigrants | Trinidad and Tobago | 6.0 /100 | #228 | Tragic 35.3% |
| Whites/Caucasians | 5.9 /100 | #229 | Tragic 35.3% |
| Immigrants | Grenada | 4.3 /100 | #230 | Tragic 35.0% |
| Immigrants | St. Vincent and the Grenadines | 4.3 /100 | #231 | Tragic 35.0% |
| Hmong | 3.4 /100 | #232 | Tragic 34.8% |
| Immigrants | Ecuador | 3.3 /100 | #233 | Tragic 34.7% |
| Guamanians/Chamorros | 3.0 /100 | #234 | Tragic 34.6% |
| Immigrants | West Indies | 2.9 /100 | #235 | Tragic 34.6% |