Lumbee vs Immigrants from Trinidad and Tobago Bachelor's Degree
COMPARE
Lumbee
Immigrants from Trinidad and Tobago
Bachelor's Degree
Bachelor's Degree Comparison
Lumbee
Immigrants from Trinidad and Tobago
24.8%
BACHELOR'S DEGREE
0.0/ 100
METRIC RATING
340th/ 347
METRIC RANK
35.3%
BACHELOR'S DEGREE
6.0/ 100
METRIC RATING
228th/ 347
METRIC RANK
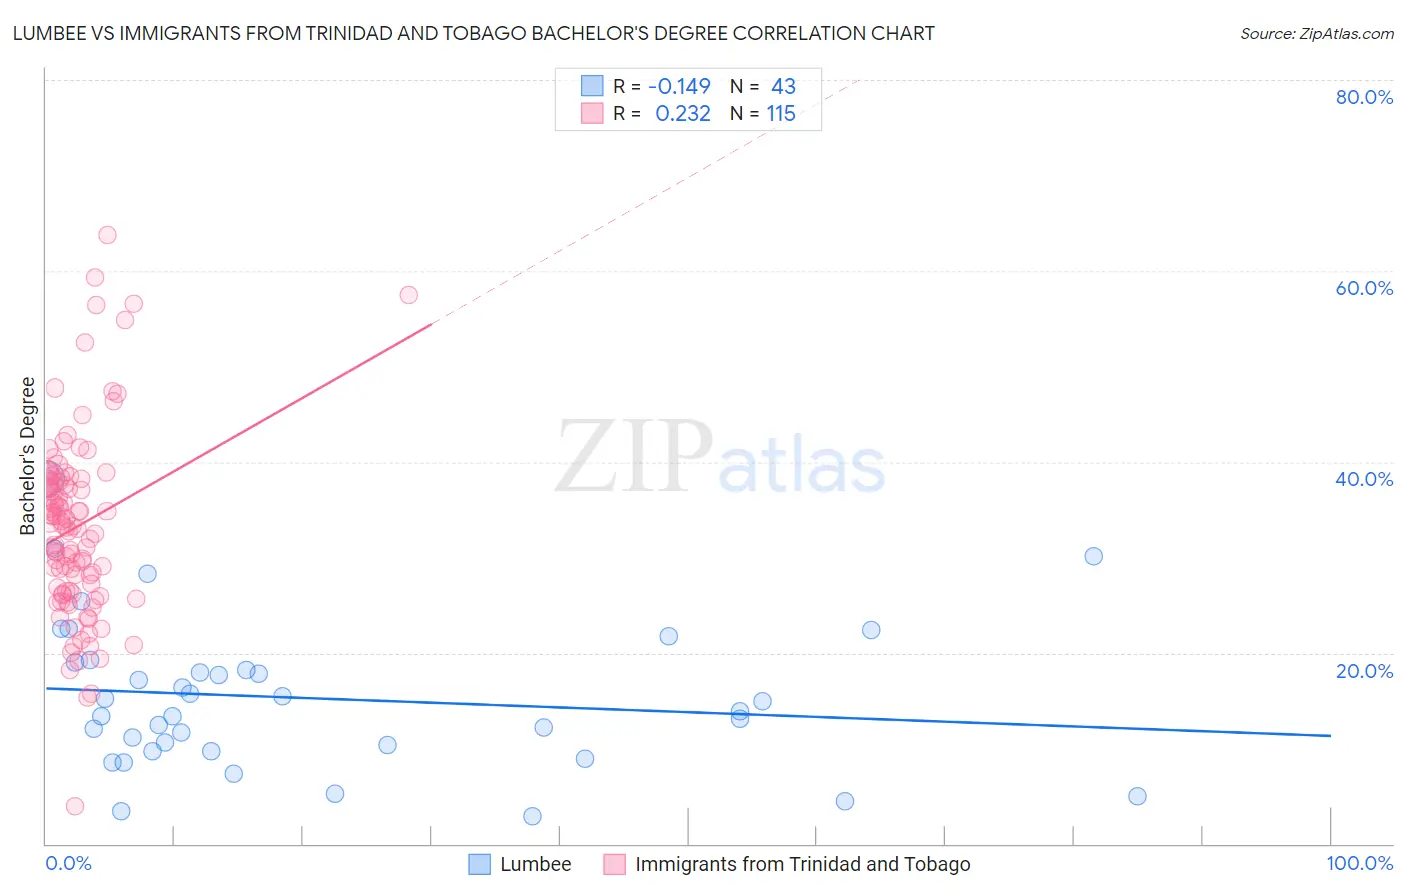
Lumbee vs Immigrants from Trinidad and Tobago Bachelor's Degree Correlation Chart
The statistical analysis conducted on geographies consisting of 92,297,287 people shows a poor negative correlation between the proportion of Lumbee and percentage of population with at least bachelor's degree education in the United States with a correlation coefficient (R) of -0.149 and weighted average of 24.8%. Similarly, the statistical analysis conducted on geographies consisting of 223,534,325 people shows a weak positive correlation between the proportion of Immigrants from Trinidad and Tobago and percentage of population with at least bachelor's degree education in the United States with a correlation coefficient (R) of 0.232 and weighted average of 35.3%, a difference of 42.6%.
Bachelor's Degree Correlation Summary
| Measurement | Lumbee | Immigrants from Trinidad and Tobago |
| Minimum | 2.9% | 4.0% |
| Maximum | 38.2% | 63.7% |
| Range | 35.2% | 59.7% |
| Mean | 15.2% | 33.2% |
| Median | 13.9% | 33.2% |
| Interquartile 25% (IQ1) | 9.7% | 26.4% |
| Interquartile 75% (IQ3) | 19.0% | 37.8% |
| Interquartile Range (IQR) | 9.2% | 11.4% |
| Standard Deviation (Sample) | 7.7% | 9.6% |
| Standard Deviation (Population) | 7.6% | 9.6% |
Similar Demographics by Bachelor's Degree
Demographics Similar to Lumbee by Bachelor's Degree
In terms of bachelor's degree, the demographic groups most similar to Lumbee are Yuman (24.5%, a difference of 0.92%), Yakama (24.5%, a difference of 1.2%), Tohono O'odham (24.4%, a difference of 1.4%), Hopi (25.3%, a difference of 2.2%), and Pueblo (25.5%, a difference of 3.2%).
| Demographics | Rating | Rank | Bachelor's Degree |
| Mexicans | 0.0 /100 | #333 | Tragic 27.1% |
| Arapaho | 0.0 /100 | #334 | Tragic 26.6% |
| Natives/Alaskans | 0.0 /100 | #335 | Tragic 26.3% |
| Immigrants | Mexico | 0.0 /100 | #336 | Tragic 26.1% |
| Inupiat | 0.0 /100 | #337 | Tragic 25.8% |
| Pueblo | 0.0 /100 | #338 | Tragic 25.5% |
| Hopi | 0.0 /100 | #339 | Tragic 25.3% |
| Lumbee | 0.0 /100 | #340 | Tragic 24.8% |
| Yuman | 0.0 /100 | #341 | Tragic 24.5% |
| Yakama | 0.0 /100 | #342 | Tragic 24.5% |
| Tohono O'odham | 0.0 /100 | #343 | Tragic 24.4% |
| Navajo | 0.0 /100 | #344 | Tragic 23.6% |
| Pima | 0.0 /100 | #345 | Tragic 23.2% |
| Houma | 0.0 /100 | #346 | Tragic 21.4% |
| Yup'ik | 0.0 /100 | #347 | Tragic 19.4% |
Demographics Similar to Immigrants from Trinidad and Tobago by Bachelor's Degree
In terms of bachelor's degree, the demographic groups most similar to Immigrants from Trinidad and Tobago are White/Caucasian (35.3%, a difference of 0.080%), Ecuadorian (35.4%, a difference of 0.23%), Portuguese (35.5%, a difference of 0.49%), Immigrants from Burma/Myanmar (35.5%, a difference of 0.53%), and Immigrants from Barbados (35.5%, a difference of 0.60%).
| Demographics | Rating | Rank | Bachelor's Degree |
| Dutch | 9.2 /100 | #221 | Tragic 35.7% |
| Trinidadians and Tobagonians | 8.8 /100 | #222 | Tragic 35.7% |
| French Canadians | 8.3 /100 | #223 | Tragic 35.6% |
| Immigrants | Barbados | 7.5 /100 | #224 | Tragic 35.5% |
| Immigrants | Burma/Myanmar | 7.3 /100 | #225 | Tragic 35.5% |
| Portuguese | 7.2 /100 | #226 | Tragic 35.5% |
| Ecuadorians | 6.6 /100 | #227 | Tragic 35.4% |
| Immigrants | Trinidad and Tobago | 6.0 /100 | #228 | Tragic 35.3% |
| Whites/Caucasians | 5.9 /100 | #229 | Tragic 35.3% |
| Immigrants | Grenada | 4.3 /100 | #230 | Tragic 35.0% |
| Immigrants | St. Vincent and the Grenadines | 4.3 /100 | #231 | Tragic 35.0% |
| Hmong | 3.4 /100 | #232 | Tragic 34.8% |
| Immigrants | Ecuador | 3.3 /100 | #233 | Tragic 34.7% |
| Guamanians/Chamorros | 3.0 /100 | #234 | Tragic 34.6% |
| Immigrants | West Indies | 2.9 /100 | #235 | Tragic 34.6% |