Yaqui vs Immigrants from Trinidad and Tobago In Labor Force | Age 45-54
COMPARE
Yaqui
Immigrants from Trinidad and Tobago
In Labor Force | Age 45-54
In Labor Force | Age 45-54 Comparison
Yaqui
Immigrants from Trinidad and Tobago
78.9%
IN LABOR FORCE | AGE 45-54
0.0/ 100
METRIC RATING
320th/ 347
METRIC RANK
82.0%
IN LABOR FORCE | AGE 45-54
1.2/ 100
METRIC RATING
237th/ 347
METRIC RANK
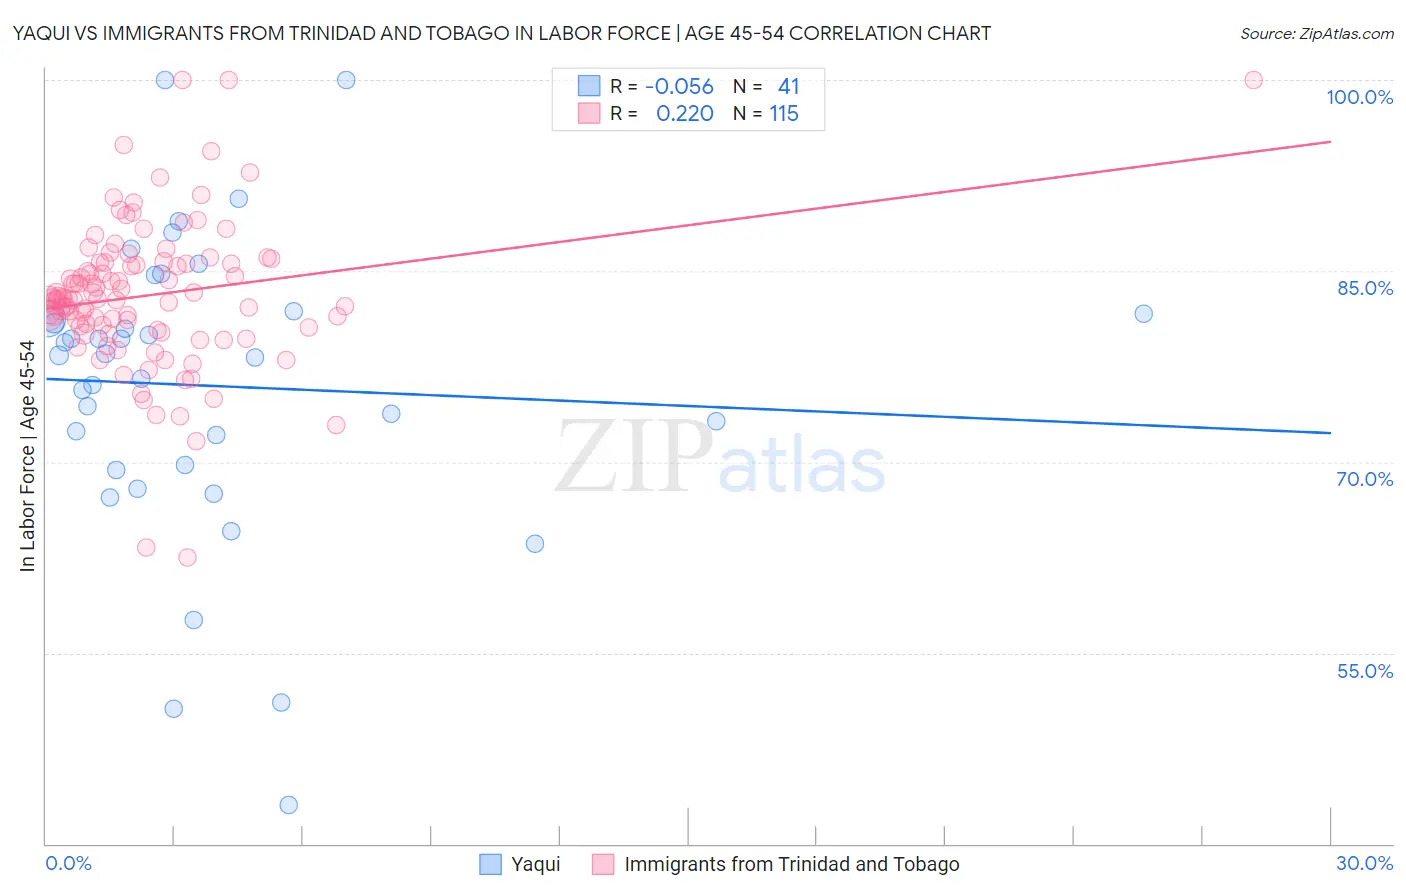
Yaqui vs Immigrants from Trinidad and Tobago In Labor Force | Age 45-54 Correlation Chart
The statistical analysis conducted on geographies consisting of 107,713,051 people shows a slight negative correlation between the proportion of Yaqui and labor force participation rate among population between the ages 45 and 54 in the United States with a correlation coefficient (R) of -0.056 and weighted average of 78.9%. Similarly, the statistical analysis conducted on geographies consisting of 223,484,344 people shows a weak positive correlation between the proportion of Immigrants from Trinidad and Tobago and labor force participation rate among population between the ages 45 and 54 in the United States with a correlation coefficient (R) of 0.220 and weighted average of 82.0%, a difference of 3.9%.
In Labor Force | Age 45-54 Correlation Summary
| Measurement | Yaqui | Immigrants from Trinidad and Tobago |
| Minimum | 43.0% | 62.5% |
| Maximum | 100.0% | 100.0% |
| Range | 57.0% | 37.5% |
| Mean | 76.0% | 83.1% |
| Median | 78.4% | 82.8% |
| Interquartile 25% (IQ1) | 69.6% | 80.6% |
| Interquartile 75% (IQ3) | 81.7% | 85.6% |
| Interquartile Range (IQR) | 12.1% | 5.0% |
| Standard Deviation (Sample) | 11.8% | 5.8% |
| Standard Deviation (Population) | 11.7% | 5.8% |
Similar Demographics by In Labor Force | Age 45-54
Demographics Similar to Yaqui by In Labor Force | Age 45-54
In terms of in labor force | age 45-54, the demographic groups most similar to Yaqui are Cherokee (79.0%, a difference of 0.10%), Chickasaw (79.0%, a difference of 0.21%), Yup'ik (78.6%, a difference of 0.30%), Comanche (79.2%, a difference of 0.38%), and Shoshone (79.3%, a difference of 0.52%).
| Demographics | Rating | Rank | In Labor Force | Age 45-54 |
| Colville | 0.0 /100 | #313 | Tragic 79.5% |
| Ottawa | 0.0 /100 | #314 | Tragic 79.5% |
| Blacks/African Americans | 0.0 /100 | #315 | Tragic 79.3% |
| Shoshone | 0.0 /100 | #316 | Tragic 79.3% |
| Comanche | 0.0 /100 | #317 | Tragic 79.2% |
| Chickasaw | 0.0 /100 | #318 | Tragic 79.0% |
| Cherokee | 0.0 /100 | #319 | Tragic 79.0% |
| Yaqui | 0.0 /100 | #320 | Tragic 78.9% |
| Yup'ik | 0.0 /100 | #321 | Tragic 78.6% |
| Crow | 0.0 /100 | #322 | Tragic 78.3% |
| Kiowa | 0.0 /100 | #323 | Tragic 78.3% |
| Dutch West Indians | 0.0 /100 | #324 | Tragic 78.2% |
| Choctaw | 0.0 /100 | #325 | Tragic 78.2% |
| Seminole | 0.0 /100 | #326 | Tragic 78.1% |
| Cajuns | 0.0 /100 | #327 | Tragic 78.1% |
Demographics Similar to Immigrants from Trinidad and Tobago by In Labor Force | Age 45-54
In terms of in labor force | age 45-54, the demographic groups most similar to Immigrants from Trinidad and Tobago are Subsaharan African (82.0%, a difference of 0.010%), Basque (82.0%, a difference of 0.010%), Trinidadian and Tobagonian (81.9%, a difference of 0.010%), Immigrants from Thailand (81.9%, a difference of 0.030%), and Immigrants from El Salvador (81.9%, a difference of 0.040%).
| Demographics | Rating | Rank | In Labor Force | Age 45-54 |
| Jamaicans | 1.8 /100 | #230 | Tragic 82.0% |
| Immigrants | Senegal | 1.7 /100 | #231 | Tragic 82.0% |
| Immigrants | Portugal | 1.7 /100 | #232 | Tragic 82.0% |
| Malaysians | 1.7 /100 | #233 | Tragic 82.0% |
| Salvadorans | 1.7 /100 | #234 | Tragic 82.0% |
| Sub-Saharan Africans | 1.2 /100 | #235 | Tragic 82.0% |
| Basques | 1.2 /100 | #236 | Tragic 82.0% |
| Immigrants | Trinidad and Tobago | 1.2 /100 | #237 | Tragic 82.0% |
| Trinidadians and Tobagonians | 1.1 /100 | #238 | Tragic 81.9% |
| Immigrants | Thailand | 1.0 /100 | #239 | Tragic 81.9% |
| Immigrants | El Salvador | 1.0 /100 | #240 | Tragic 81.9% |
| Immigrants | Cambodia | 0.8 /100 | #241 | Tragic 81.9% |
| Whites/Caucasians | 0.7 /100 | #242 | Tragic 81.9% |
| Samoans | 0.6 /100 | #243 | Tragic 81.8% |
| Celtics | 0.4 /100 | #244 | Tragic 81.8% |