Yaqui vs Italian Bachelor's Degree
COMPARE
Yaqui
Italian
Bachelor's Degree
Bachelor's Degree Comparison
Yaqui
Italians
29.0%
BACHELOR'S DEGREE
0.0/ 100
METRIC RATING
318th/ 347
METRIC RANK
40.1%
BACHELOR'S DEGREE
91.9/ 100
METRIC RATING
131st/ 347
METRIC RANK
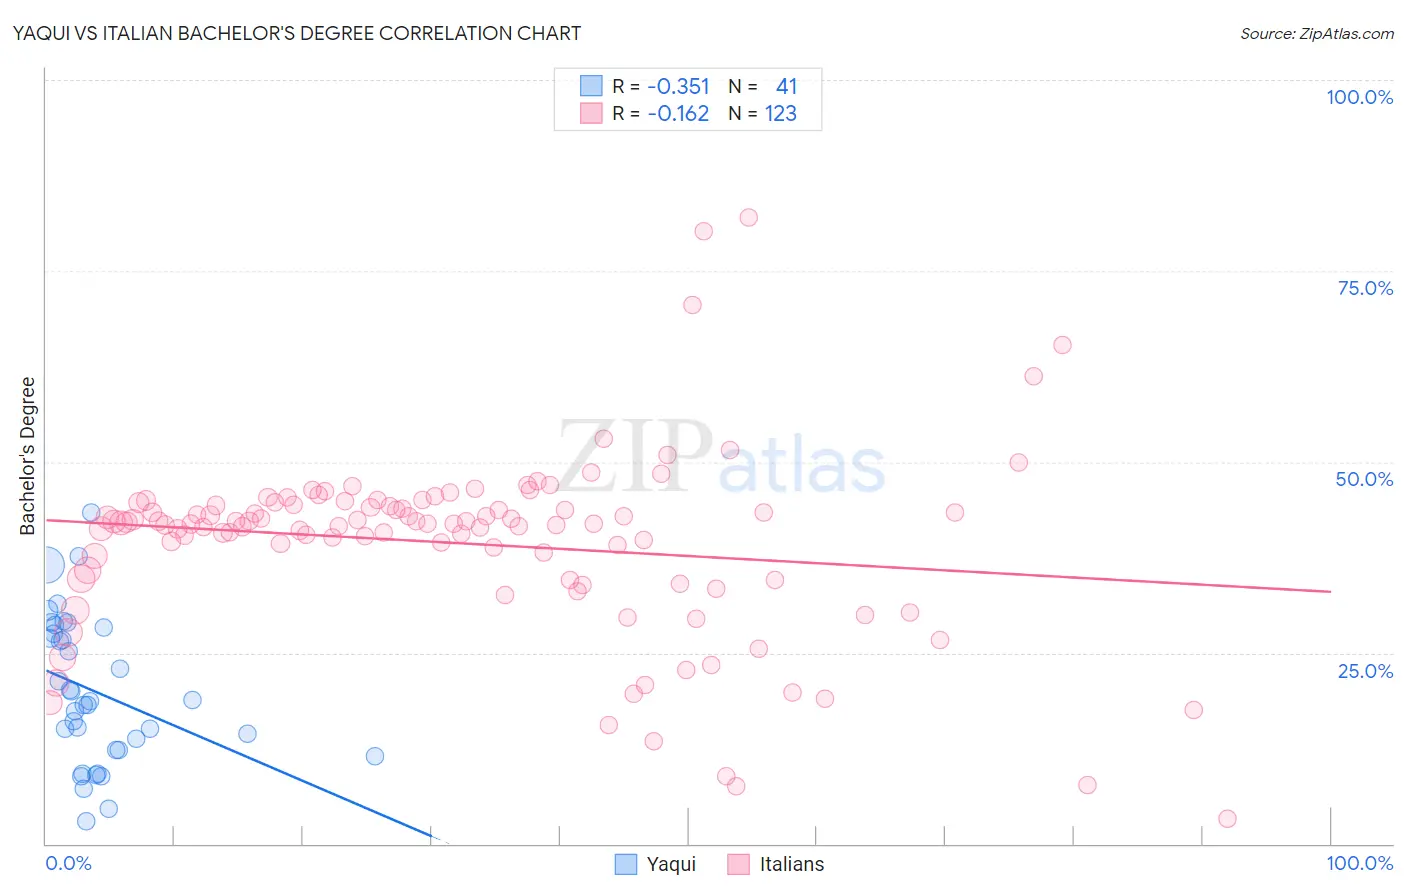
Yaqui vs Italian Bachelor's Degree Correlation Chart
The statistical analysis conducted on geographies consisting of 107,733,965 people shows a mild negative correlation between the proportion of Yaqui and percentage of population with at least bachelor's degree education in the United States with a correlation coefficient (R) of -0.351 and weighted average of 29.0%. Similarly, the statistical analysis conducted on geographies consisting of 574,930,631 people shows a poor negative correlation between the proportion of Italians and percentage of population with at least bachelor's degree education in the United States with a correlation coefficient (R) of -0.162 and weighted average of 40.1%, a difference of 38.2%.
Bachelor's Degree Correlation Summary
| Measurement | Yaqui | Italian |
| Minimum | 2.9% | 3.2% |
| Maximum | 43.4% | 82.0% |
| Range | 40.5% | 78.7% |
| Mean | 19.9% | 39.3% |
| Median | 18.7% | 42.0% |
| Interquartile 25% (IQ1) | 12.3% | 34.5% |
| Interquartile 75% (IQ3) | 27.9% | 44.3% |
| Interquartile Range (IQR) | 15.6% | 9.8% |
| Standard Deviation (Sample) | 9.6% | 12.1% |
| Standard Deviation (Population) | 9.4% | 12.1% |
Similar Demographics by Bachelor's Degree
Demographics Similar to Yaqui by Bachelor's Degree
In terms of bachelor's degree, the demographic groups most similar to Yaqui are Colville (29.0%, a difference of 0.050%), Sioux (29.1%, a difference of 0.25%), Creek (28.9%, a difference of 0.45%), Kiowa (28.8%, a difference of 0.50%), and Alaskan Athabascan (28.8%, a difference of 0.58%).
| Demographics | Rating | Rank | Bachelor's Degree |
| Choctaw | 0.0 /100 | #311 | Tragic 29.4% |
| Seminole | 0.0 /100 | #312 | Tragic 29.4% |
| Alaska Natives | 0.0 /100 | #313 | Tragic 29.4% |
| Shoshone | 0.0 /100 | #314 | Tragic 29.3% |
| Immigrants | Cabo Verde | 0.0 /100 | #315 | Tragic 29.2% |
| Sioux | 0.0 /100 | #316 | Tragic 29.1% |
| Colville | 0.0 /100 | #317 | Tragic 29.0% |
| Yaqui | 0.0 /100 | #318 | Tragic 29.0% |
| Creek | 0.0 /100 | #319 | Tragic 28.9% |
| Kiowa | 0.0 /100 | #320 | Tragic 28.8% |
| Alaskan Athabascans | 0.0 /100 | #321 | Tragic 28.8% |
| Tsimshian | 0.0 /100 | #322 | Tragic 28.8% |
| Fijians | 0.0 /100 | #323 | Tragic 28.7% |
| Dutch West Indians | 0.0 /100 | #324 | Tragic 28.5% |
| Pennsylvania Germans | 0.0 /100 | #325 | Tragic 28.4% |
Demographics Similar to Italians by Bachelor's Degree
In terms of bachelor's degree, the demographic groups most similar to Italians are Sierra Leonean (40.1%, a difference of 0.080%), Serbian (40.1%, a difference of 0.15%), Taiwanese (40.0%, a difference of 0.25%), Immigrants from Southern Europe (40.0%, a difference of 0.25%), and Immigrants from Venezuela (40.2%, a difference of 0.32%).
| Demographics | Rating | Rank | Bachelor's Degree |
| Immigrants | Eritrea | 94.3 /100 | #124 | Exceptional 40.4% |
| British | 94.2 /100 | #125 | Exceptional 40.4% |
| Immigrants | Eastern Africa | 94.1 /100 | #126 | Exceptional 40.4% |
| Immigrants | Jordan | 93.4 /100 | #127 | Exceptional 40.3% |
| Immigrants | Venezuela | 92.9 /100 | #128 | Exceptional 40.2% |
| Serbians | 92.4 /100 | #129 | Exceptional 40.1% |
| Sierra Leoneans | 92.2 /100 | #130 | Exceptional 40.1% |
| Italians | 91.9 /100 | #131 | Exceptional 40.1% |
| Taiwanese | 91.1 /100 | #132 | Exceptional 40.0% |
| Immigrants | Southern Europe | 91.1 /100 | #133 | Exceptional 40.0% |
| Assyrians/Chaldeans/Syriacs | 89.4 /100 | #134 | Excellent 39.8% |
| Luxembourgers | 89.1 /100 | #135 | Excellent 39.8% |
| Pakistanis | 88.2 /100 | #136 | Excellent 39.7% |
| Icelanders | 86.5 /100 | #137 | Excellent 39.5% |
| Europeans | 85.6 /100 | #138 | Excellent 39.5% |