Yaqui vs Ugandan Bachelor's Degree
COMPARE
Yaqui
Ugandan
Bachelor's Degree
Bachelor's Degree Comparison
Yaqui
Ugandans
29.0%
BACHELOR'S DEGREE
0.0/ 100
METRIC RATING
318th/ 347
METRIC RANK
40.8%
BACHELOR'S DEGREE
96.3/ 100
METRIC RATING
112th/ 347
METRIC RANK
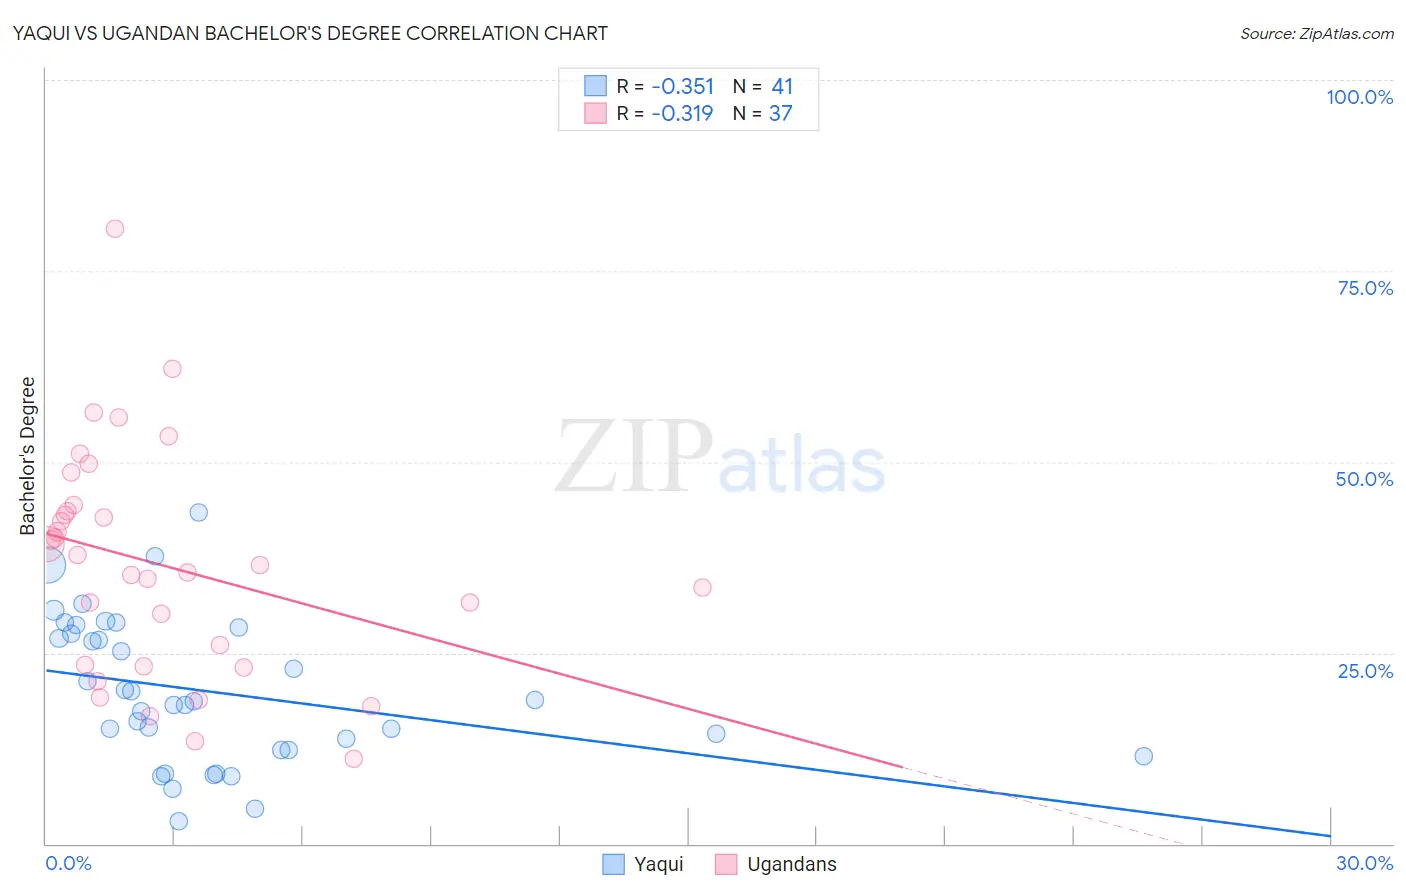
Yaqui vs Ugandan Bachelor's Degree Correlation Chart
The statistical analysis conducted on geographies consisting of 107,733,965 people shows a mild negative correlation between the proportion of Yaqui and percentage of population with at least bachelor's degree education in the United States with a correlation coefficient (R) of -0.351 and weighted average of 29.0%. Similarly, the statistical analysis conducted on geographies consisting of 94,016,399 people shows a mild negative correlation between the proportion of Ugandans and percentage of population with at least bachelor's degree education in the United States with a correlation coefficient (R) of -0.319 and weighted average of 40.8%, a difference of 40.8%.
Bachelor's Degree Correlation Summary
| Measurement | Yaqui | Ugandan |
| Minimum | 2.9% | 11.1% |
| Maximum | 43.4% | 80.5% |
| Range | 40.5% | 69.4% |
| Mean | 19.9% | 36.6% |
| Median | 18.7% | 36.6% |
| Interquartile 25% (IQ1) | 12.3% | 23.3% |
| Interquartile 75% (IQ3) | 27.9% | 43.9% |
| Interquartile Range (IQR) | 15.6% | 20.6% |
| Standard Deviation (Sample) | 9.6% | 14.9% |
| Standard Deviation (Population) | 9.4% | 14.7% |
Similar Demographics by Bachelor's Degree
Demographics Similar to Yaqui by Bachelor's Degree
In terms of bachelor's degree, the demographic groups most similar to Yaqui are Colville (29.0%, a difference of 0.050%), Sioux (29.1%, a difference of 0.25%), Creek (28.9%, a difference of 0.45%), Kiowa (28.8%, a difference of 0.50%), and Alaskan Athabascan (28.8%, a difference of 0.58%).
| Demographics | Rating | Rank | Bachelor's Degree |
| Choctaw | 0.0 /100 | #311 | Tragic 29.4% |
| Seminole | 0.0 /100 | #312 | Tragic 29.4% |
| Alaska Natives | 0.0 /100 | #313 | Tragic 29.4% |
| Shoshone | 0.0 /100 | #314 | Tragic 29.3% |
| Immigrants | Cabo Verde | 0.0 /100 | #315 | Tragic 29.2% |
| Sioux | 0.0 /100 | #316 | Tragic 29.1% |
| Colville | 0.0 /100 | #317 | Tragic 29.0% |
| Yaqui | 0.0 /100 | #318 | Tragic 29.0% |
| Creek | 0.0 /100 | #319 | Tragic 28.9% |
| Kiowa | 0.0 /100 | #320 | Tragic 28.8% |
| Alaskan Athabascans | 0.0 /100 | #321 | Tragic 28.8% |
| Tsimshian | 0.0 /100 | #322 | Tragic 28.8% |
| Fijians | 0.0 /100 | #323 | Tragic 28.7% |
| Dutch West Indians | 0.0 /100 | #324 | Tragic 28.5% |
| Pennsylvania Germans | 0.0 /100 | #325 | Tragic 28.4% |
Demographics Similar to Ugandans by Bachelor's Degree
In terms of bachelor's degree, the demographic groups most similar to Ugandans are Brazilian (40.8%, a difference of 0.040%), Immigrants from Chile (40.8%, a difference of 0.050%), Afghan (40.8%, a difference of 0.070%), Albanian (40.9%, a difference of 0.090%), and Arab (40.9%, a difference of 0.17%).
| Demographics | Rating | Rank | Bachelor's Degree |
| Syrians | 97.4 /100 | #105 | Exceptional 41.1% |
| Alsatians | 97.0 /100 | #106 | Exceptional 41.0% |
| Northern Europeans | 96.8 /100 | #107 | Exceptional 41.0% |
| Ukrainians | 96.6 /100 | #108 | Exceptional 40.9% |
| Arabs | 96.6 /100 | #109 | Exceptional 40.9% |
| Albanians | 96.5 /100 | #110 | Exceptional 40.9% |
| Immigrants | Chile | 96.4 /100 | #111 | Exceptional 40.8% |
| Ugandans | 96.3 /100 | #112 | Exceptional 40.8% |
| Brazilians | 96.3 /100 | #113 | Exceptional 40.8% |
| Afghans | 96.2 /100 | #114 | Exceptional 40.8% |
| Palestinians | 95.8 /100 | #115 | Exceptional 40.7% |
| Immigrants | Uganda | 95.7 /100 | #116 | Exceptional 40.7% |
| Austrians | 95.5 /100 | #117 | Exceptional 40.6% |
| Croatians | 95.5 /100 | #118 | Exceptional 40.6% |
| Immigrants | Syria | 94.9 /100 | #119 | Exceptional 40.5% |