Bulgarian vs Immigrants from Trinidad and Tobago Bachelor's Degree
COMPARE
Bulgarian
Immigrants from Trinidad and Tobago
Bachelor's Degree
Bachelor's Degree Comparison
Bulgarians
Immigrants from Trinidad and Tobago
45.3%
BACHELOR'S DEGREE
100.0/ 100
METRIC RATING
38th/ 347
METRIC RANK
35.3%
BACHELOR'S DEGREE
6.0/ 100
METRIC RATING
228th/ 347
METRIC RANK
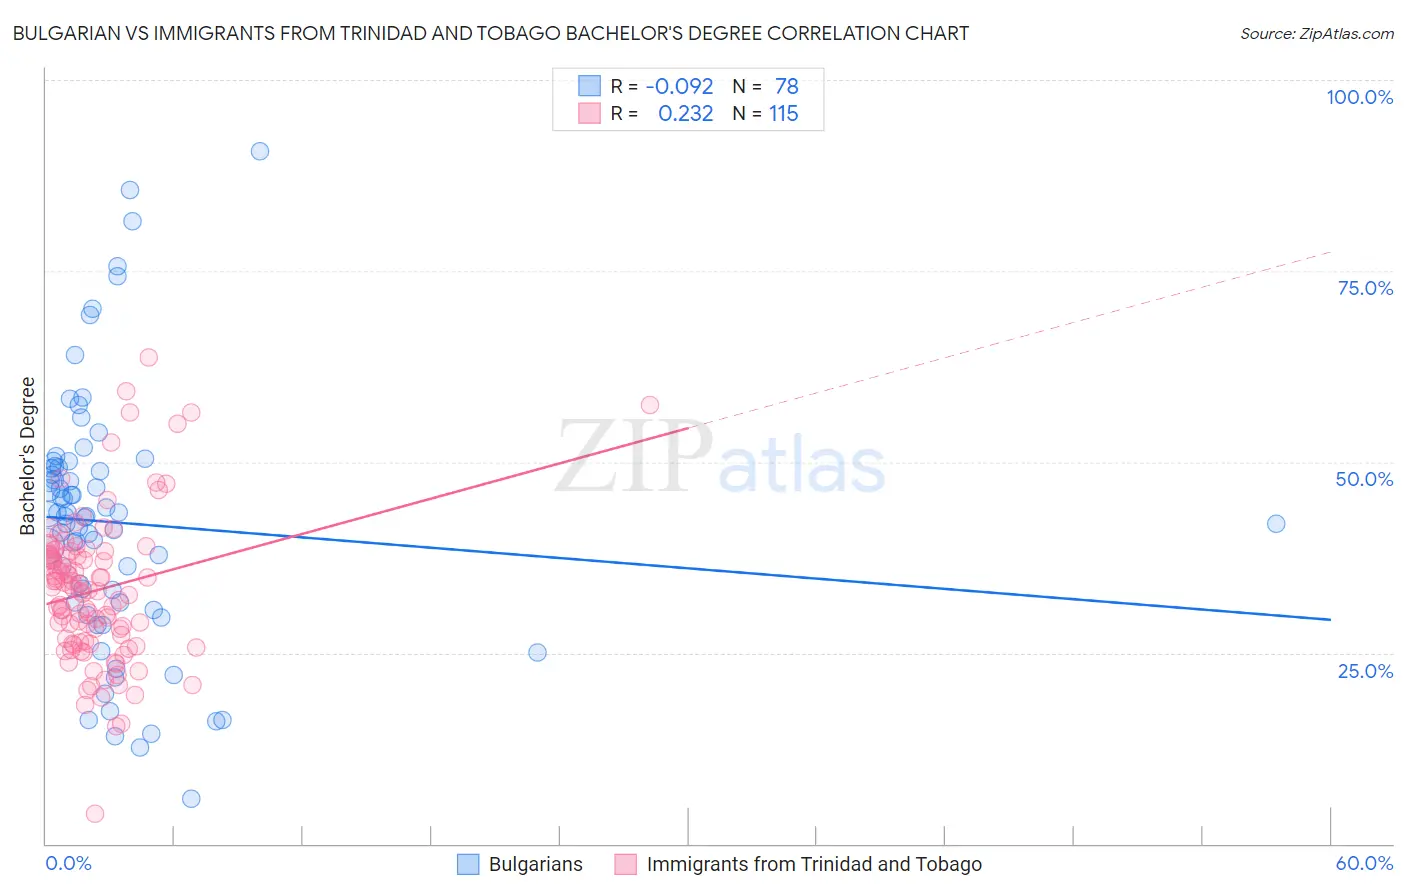
Bulgarian vs Immigrants from Trinidad and Tobago Bachelor's Degree Correlation Chart
The statistical analysis conducted on geographies consisting of 205,616,676 people shows a slight negative correlation between the proportion of Bulgarians and percentage of population with at least bachelor's degree education in the United States with a correlation coefficient (R) of -0.092 and weighted average of 45.3%. Similarly, the statistical analysis conducted on geographies consisting of 223,534,325 people shows a weak positive correlation between the proportion of Immigrants from Trinidad and Tobago and percentage of population with at least bachelor's degree education in the United States with a correlation coefficient (R) of 0.232 and weighted average of 35.3%, a difference of 28.3%.
Bachelor's Degree Correlation Summary
| Measurement | Bulgarian | Immigrants from Trinidad and Tobago |
| Minimum | 5.9% | 4.0% |
| Maximum | 90.7% | 63.7% |
| Range | 84.8% | 59.7% |
| Mean | 42.0% | 33.2% |
| Median | 42.9% | 33.2% |
| Interquartile 25% (IQ1) | 31.5% | 26.4% |
| Interquartile 75% (IQ3) | 49.3% | 37.8% |
| Interquartile Range (IQR) | 17.7% | 11.4% |
| Standard Deviation (Sample) | 16.8% | 9.6% |
| Standard Deviation (Population) | 16.7% | 9.6% |
Similar Demographics by Bachelor's Degree
Demographics Similar to Bulgarians by Bachelor's Degree
In terms of bachelor's degree, the demographic groups most similar to Bulgarians are Russian (45.3%, a difference of 0.090%), Mongolian (45.4%, a difference of 0.24%), Immigrants from Russia (45.4%, a difference of 0.26%), Immigrants from Denmark (45.4%, a difference of 0.28%), and Immigrants from Latvia (45.1%, a difference of 0.33%).
| Demographics | Rating | Rank | Bachelor's Degree |
| Latvians | 100.0 /100 | #31 | Exceptional 46.1% |
| Immigrants | Turkey | 100.0 /100 | #32 | Exceptional 46.0% |
| Immigrants | Northern Europe | 100.0 /100 | #33 | Exceptional 45.6% |
| Immigrants | Denmark | 100.0 /100 | #34 | Exceptional 45.4% |
| Immigrants | Russia | 100.0 /100 | #35 | Exceptional 45.4% |
| Mongolians | 100.0 /100 | #36 | Exceptional 45.4% |
| Russians | 100.0 /100 | #37 | Exceptional 45.3% |
| Bulgarians | 100.0 /100 | #38 | Exceptional 45.3% |
| Immigrants | Latvia | 100.0 /100 | #39 | Exceptional 45.1% |
| Immigrants | Belarus | 100.0 /100 | #40 | Exceptional 45.0% |
| Immigrants | Malaysia | 100.0 /100 | #41 | Exceptional 45.0% |
| Immigrants | Saudi Arabia | 100.0 /100 | #42 | Exceptional 44.8% |
| Immigrants | South Africa | 99.9 /100 | #43 | Exceptional 44.8% |
| Immigrants | Lithuania | 99.9 /100 | #44 | Exceptional 44.6% |
| Immigrants | Kuwait | 99.9 /100 | #45 | Exceptional 44.6% |
Demographics Similar to Immigrants from Trinidad and Tobago by Bachelor's Degree
In terms of bachelor's degree, the demographic groups most similar to Immigrants from Trinidad and Tobago are White/Caucasian (35.3%, a difference of 0.080%), Ecuadorian (35.4%, a difference of 0.23%), Portuguese (35.5%, a difference of 0.49%), Immigrants from Burma/Myanmar (35.5%, a difference of 0.53%), and Immigrants from Barbados (35.5%, a difference of 0.60%).
| Demographics | Rating | Rank | Bachelor's Degree |
| Dutch | 9.2 /100 | #221 | Tragic 35.7% |
| Trinidadians and Tobagonians | 8.8 /100 | #222 | Tragic 35.7% |
| French Canadians | 8.3 /100 | #223 | Tragic 35.6% |
| Immigrants | Barbados | 7.5 /100 | #224 | Tragic 35.5% |
| Immigrants | Burma/Myanmar | 7.3 /100 | #225 | Tragic 35.5% |
| Portuguese | 7.2 /100 | #226 | Tragic 35.5% |
| Ecuadorians | 6.6 /100 | #227 | Tragic 35.4% |
| Immigrants | Trinidad and Tobago | 6.0 /100 | #228 | Tragic 35.3% |
| Whites/Caucasians | 5.9 /100 | #229 | Tragic 35.3% |
| Immigrants | Grenada | 4.3 /100 | #230 | Tragic 35.0% |
| Immigrants | St. Vincent and the Grenadines | 4.3 /100 | #231 | Tragic 35.0% |
| Hmong | 3.4 /100 | #232 | Tragic 34.8% |
| Immigrants | Ecuador | 3.3 /100 | #233 | Tragic 34.7% |
| Guamanians/Chamorros | 3.0 /100 | #234 | Tragic 34.6% |
| Immigrants | West Indies | 2.9 /100 | #235 | Tragic 34.6% |