Yaqui vs Immigrants from Malaysia Bachelor's Degree
COMPARE
Yaqui
Immigrants from Malaysia
Bachelor's Degree
Bachelor's Degree Comparison
Yaqui
Immigrants from Malaysia
29.0%
BACHELOR'S DEGREE
0.0/ 100
METRIC RATING
318th/ 347
METRIC RANK
45.0%
BACHELOR'S DEGREE
100.0/ 100
METRIC RATING
41st/ 347
METRIC RANK
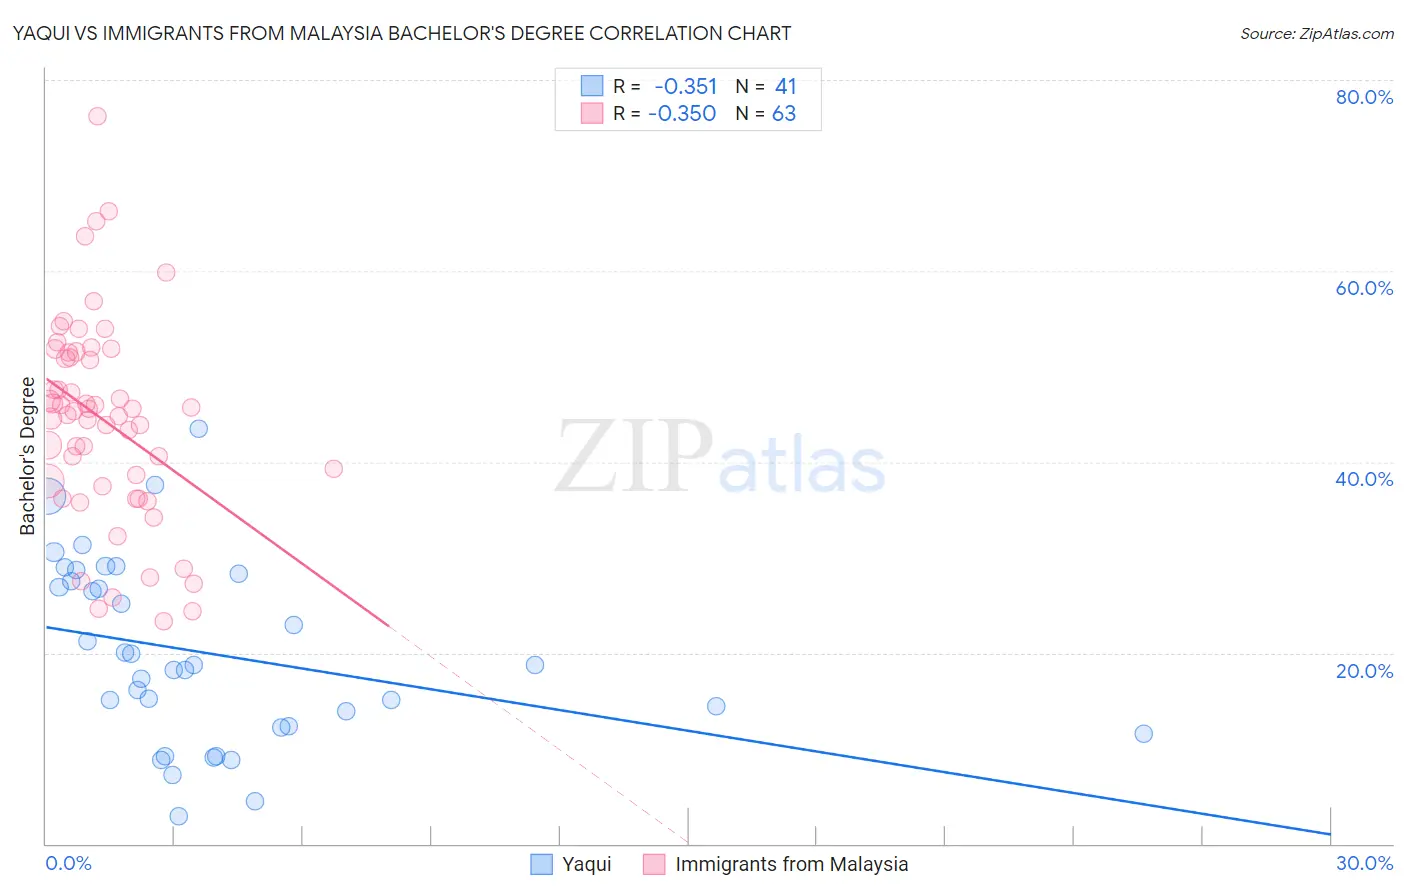
Yaqui vs Immigrants from Malaysia Bachelor's Degree Correlation Chart
The statistical analysis conducted on geographies consisting of 107,733,965 people shows a mild negative correlation between the proportion of Yaqui and percentage of population with at least bachelor's degree education in the United States with a correlation coefficient (R) of -0.351 and weighted average of 29.0%. Similarly, the statistical analysis conducted on geographies consisting of 197,964,670 people shows a mild negative correlation between the proportion of Immigrants from Malaysia and percentage of population with at least bachelor's degree education in the United States with a correlation coefficient (R) of -0.350 and weighted average of 45.0%, a difference of 55.3%.
Bachelor's Degree Correlation Summary
| Measurement | Yaqui | Immigrants from Malaysia |
| Minimum | 2.9% | 23.2% |
| Maximum | 43.4% | 76.2% |
| Range | 40.5% | 53.0% |
| Mean | 19.9% | 44.4% |
| Median | 18.7% | 45.3% |
| Interquartile 25% (IQ1) | 12.3% | 37.4% |
| Interquartile 75% (IQ3) | 27.9% | 51.4% |
| Interquartile Range (IQR) | 15.6% | 14.1% |
| Standard Deviation (Sample) | 9.6% | 10.7% |
| Standard Deviation (Population) | 9.4% | 10.6% |
Similar Demographics by Bachelor's Degree
Demographics Similar to Yaqui by Bachelor's Degree
In terms of bachelor's degree, the demographic groups most similar to Yaqui are Colville (29.0%, a difference of 0.050%), Sioux (29.1%, a difference of 0.25%), Creek (28.9%, a difference of 0.45%), Kiowa (28.8%, a difference of 0.50%), and Alaskan Athabascan (28.8%, a difference of 0.58%).
| Demographics | Rating | Rank | Bachelor's Degree |
| Choctaw | 0.0 /100 | #311 | Tragic 29.4% |
| Seminole | 0.0 /100 | #312 | Tragic 29.4% |
| Alaska Natives | 0.0 /100 | #313 | Tragic 29.4% |
| Shoshone | 0.0 /100 | #314 | Tragic 29.3% |
| Immigrants | Cabo Verde | 0.0 /100 | #315 | Tragic 29.2% |
| Sioux | 0.0 /100 | #316 | Tragic 29.1% |
| Colville | 0.0 /100 | #317 | Tragic 29.0% |
| Yaqui | 0.0 /100 | #318 | Tragic 29.0% |
| Creek | 0.0 /100 | #319 | Tragic 28.9% |
| Kiowa | 0.0 /100 | #320 | Tragic 28.8% |
| Alaskan Athabascans | 0.0 /100 | #321 | Tragic 28.8% |
| Tsimshian | 0.0 /100 | #322 | Tragic 28.8% |
| Fijians | 0.0 /100 | #323 | Tragic 28.7% |
| Dutch West Indians | 0.0 /100 | #324 | Tragic 28.5% |
| Pennsylvania Germans | 0.0 /100 | #325 | Tragic 28.4% |
Demographics Similar to Immigrants from Malaysia by Bachelor's Degree
In terms of bachelor's degree, the demographic groups most similar to Immigrants from Malaysia are Immigrants from Belarus (45.0%, a difference of 0.040%), Immigrants from Latvia (45.1%, a difference of 0.31%), Immigrants from Saudi Arabia (44.8%, a difference of 0.38%), Immigrants from South Africa (44.8%, a difference of 0.52%), and Bulgarian (45.3%, a difference of 0.64%).
| Demographics | Rating | Rank | Bachelor's Degree |
| Immigrants | Denmark | 100.0 /100 | #34 | Exceptional 45.4% |
| Immigrants | Russia | 100.0 /100 | #35 | Exceptional 45.4% |
| Mongolians | 100.0 /100 | #36 | Exceptional 45.4% |
| Russians | 100.0 /100 | #37 | Exceptional 45.3% |
| Bulgarians | 100.0 /100 | #38 | Exceptional 45.3% |
| Immigrants | Latvia | 100.0 /100 | #39 | Exceptional 45.1% |
| Immigrants | Belarus | 100.0 /100 | #40 | Exceptional 45.0% |
| Immigrants | Malaysia | 100.0 /100 | #41 | Exceptional 45.0% |
| Immigrants | Saudi Arabia | 100.0 /100 | #42 | Exceptional 44.8% |
| Immigrants | South Africa | 99.9 /100 | #43 | Exceptional 44.8% |
| Immigrants | Lithuania | 99.9 /100 | #44 | Exceptional 44.6% |
| Immigrants | Kuwait | 99.9 /100 | #45 | Exceptional 44.6% |
| Immigrants | Bulgaria | 99.9 /100 | #46 | Exceptional 44.6% |
| Bolivians | 99.9 /100 | #47 | Exceptional 44.6% |
| Estonians | 99.9 /100 | #48 | Exceptional 44.6% |