Yakama vs Bahamian College, Under 1 year
COMPARE
Yakama
Bahamian
College, Under 1 year
College, Under 1 year Comparison
Yakama
Bahamians
52.6%
COLLEGE, UNDER 1 YEAR
0.0/ 100
METRIC RATING
344th/ 347
METRIC RANK
60.3%
COLLEGE, UNDER 1 YEAR
0.1/ 100
METRIC RATING
277th/ 347
METRIC RANK
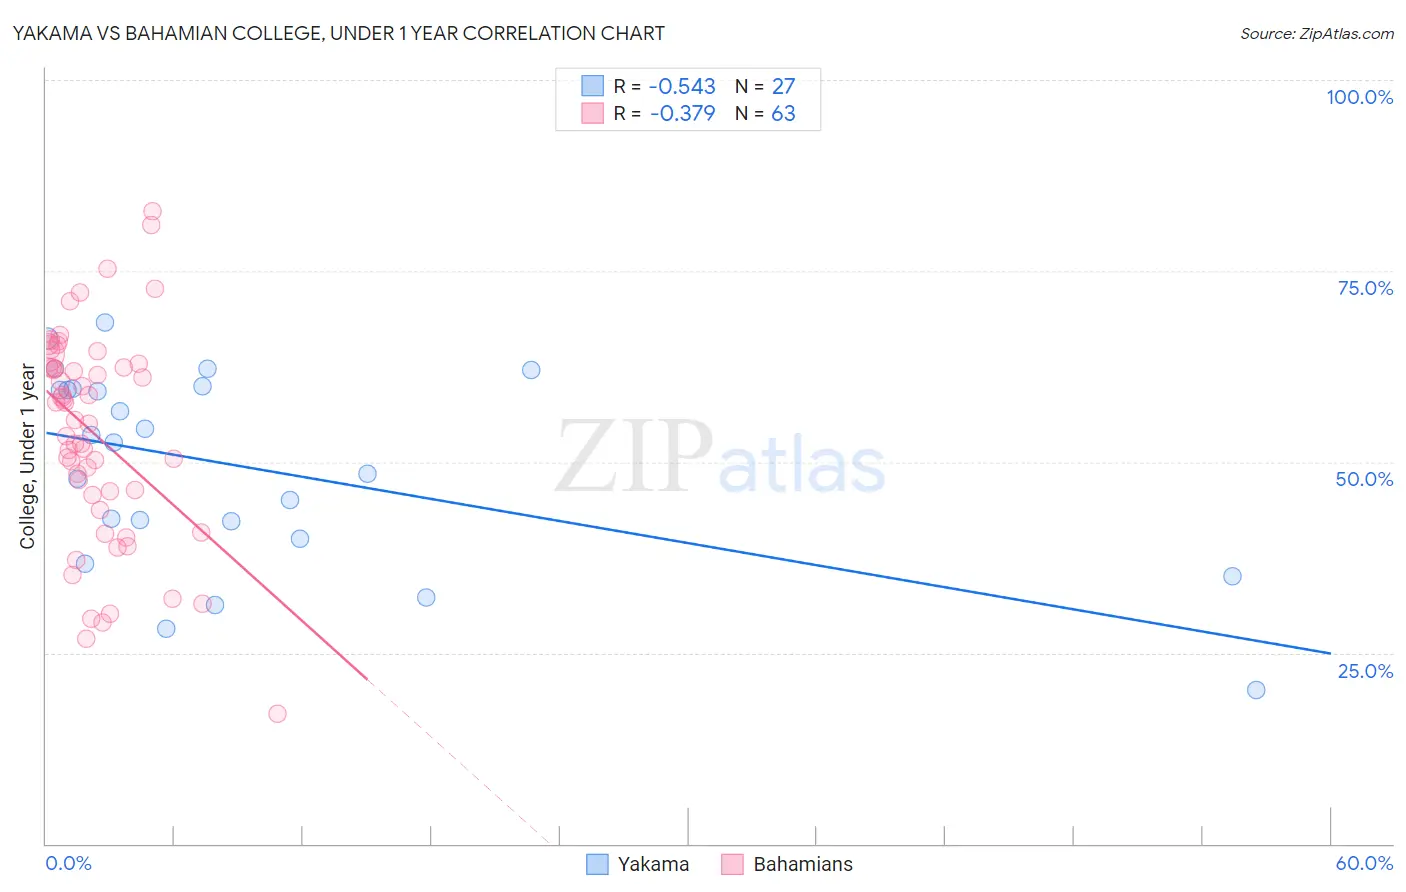
Yakama vs Bahamian College, Under 1 year Correlation Chart
The statistical analysis conducted on geographies consisting of 19,923,144 people shows a substantial negative correlation between the proportion of Yakama and percentage of population with at least college, under 1 year education in the United States with a correlation coefficient (R) of -0.543 and weighted average of 52.6%. Similarly, the statistical analysis conducted on geographies consisting of 112,705,508 people shows a mild negative correlation between the proportion of Bahamians and percentage of population with at least college, under 1 year education in the United States with a correlation coefficient (R) of -0.379 and weighted average of 60.3%, a difference of 14.5%.
College, Under 1 year Correlation Summary
| Measurement | Yakama | Bahamian |
| Minimum | 20.2% | 17.1% |
| Maximum | 68.2% | 82.8% |
| Range | 48.1% | 65.7% |
| Mean | 49.2% | 53.5% |
| Median | 52.5% | 55.5% |
| Interquartile 25% (IQ1) | 40.0% | 45.7% |
| Interquartile 75% (IQ3) | 59.5% | 62.4% |
| Interquartile Range (IQR) | 19.6% | 16.7% |
| Standard Deviation (Sample) | 12.8% | 13.8% |
| Standard Deviation (Population) | 12.6% | 13.7% |
Similar Demographics by College, Under 1 year
Demographics Similar to Yakama by College, Under 1 year
In terms of college, under 1 year, the demographic groups most similar to Yakama are Tohono O'odham (52.8%, a difference of 0.30%), Immigrants from Mexico (53.7%, a difference of 1.9%), Immigrants from Cabo Verde (53.7%, a difference of 2.0%), Pima (51.4%, a difference of 2.4%), and Spanish American Indian (54.0%, a difference of 2.5%).
| Demographics | Rating | Rank | College, Under 1 year |
| Yuman | 0.0 /100 | #333 | Tragic 55.1% |
| Immigrants | Azores | 0.0 /100 | #334 | Tragic 54.7% |
| Inupiat | 0.0 /100 | #335 | Tragic 54.6% |
| Pennsylvania Germans | 0.0 /100 | #336 | Tragic 54.5% |
| Immigrants | Central America | 0.0 /100 | #337 | Tragic 54.4% |
| Lumbee | 0.0 /100 | #338 | Tragic 54.2% |
| Immigrants | Dominican Republic | 0.0 /100 | #339 | Tragic 54.0% |
| Spanish American Indians | 0.0 /100 | #340 | Tragic 54.0% |
| Immigrants | Cabo Verde | 0.0 /100 | #341 | Tragic 53.7% |
| Immigrants | Mexico | 0.0 /100 | #342 | Tragic 53.7% |
| Tohono O'odham | 0.0 /100 | #343 | Tragic 52.8% |
| Yakama | 0.0 /100 | #344 | Tragic 52.6% |
| Pima | 0.0 /100 | #345 | Tragic 51.4% |
| Houma | 0.0 /100 | #346 | Tragic 47.6% |
| Yup'ik | 0.0 /100 | #347 | Tragic 45.8% |
Demographics Similar to Bahamians by College, Under 1 year
In terms of college, under 1 year, the demographic groups most similar to Bahamians are Yaqui (60.2%, a difference of 0.030%), Ute (60.2%, a difference of 0.050%), Arapaho (60.3%, a difference of 0.14%), Crow (60.2%, a difference of 0.14%), and Immigrants from Barbados (60.4%, a difference of 0.17%).
| Demographics | Rating | Rank | College, Under 1 year |
| Cheyenne | 0.1 /100 | #270 | Tragic 60.6% |
| U.S. Virgin Islanders | 0.1 /100 | #271 | Tragic 60.6% |
| Jamaicans | 0.1 /100 | #272 | Tragic 60.5% |
| Chickasaw | 0.1 /100 | #273 | Tragic 60.4% |
| Alaska Natives | 0.1 /100 | #274 | Tragic 60.4% |
| Immigrants | Barbados | 0.1 /100 | #275 | Tragic 60.4% |
| Arapaho | 0.1 /100 | #276 | Tragic 60.3% |
| Bahamians | 0.1 /100 | #277 | Tragic 60.3% |
| Yaqui | 0.1 /100 | #278 | Tragic 60.2% |
| Ute | 0.1 /100 | #279 | Tragic 60.2% |
| Crow | 0.1 /100 | #280 | Tragic 60.2% |
| Cherokee | 0.1 /100 | #281 | Tragic 60.1% |
| Belizeans | 0.1 /100 | #282 | Tragic 60.1% |
| Immigrants | Jamaica | 0.0 /100 | #283 | Tragic 59.7% |
| Immigrants | St. Vincent and the Grenadines | 0.0 /100 | #284 | Tragic 59.6% |