Immigrants from Peru vs Bahamian College, Under 1 year
COMPARE
Immigrants from Peru
Bahamian
College, Under 1 year
College, Under 1 year Comparison
Immigrants from Peru
Bahamians
63.1%
COLLEGE, UNDER 1 YEAR
4.0/ 100
METRIC RATING
225th/ 347
METRIC RANK
60.3%
COLLEGE, UNDER 1 YEAR
0.1/ 100
METRIC RATING
277th/ 347
METRIC RANK
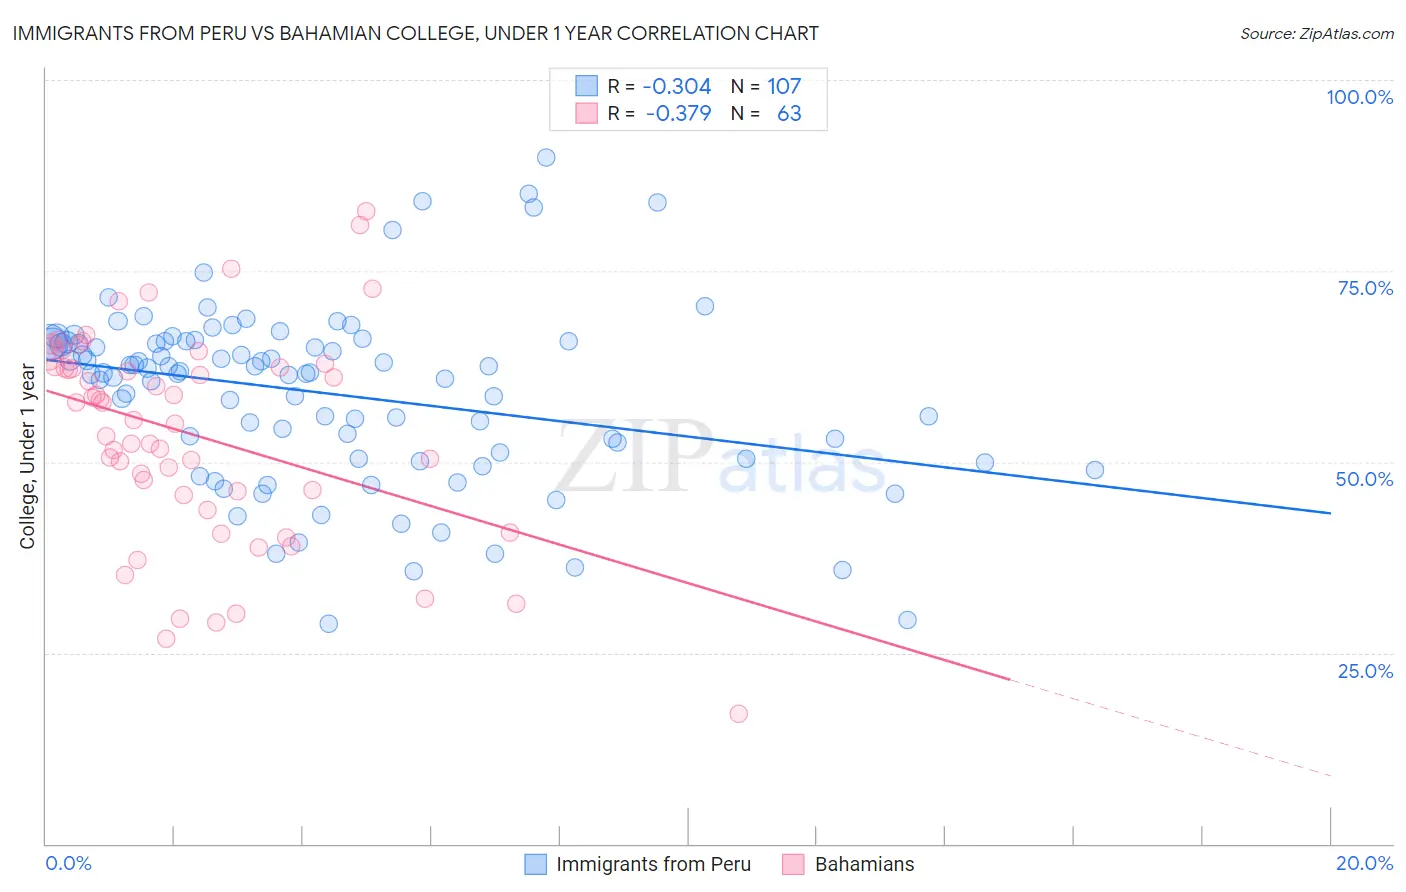
Immigrants from Peru vs Bahamian College, Under 1 year Correlation Chart
The statistical analysis conducted on geographies consisting of 328,860,969 people shows a mild negative correlation between the proportion of Immigrants from Peru and percentage of population with at least college, under 1 year education in the United States with a correlation coefficient (R) of -0.304 and weighted average of 63.1%. Similarly, the statistical analysis conducted on geographies consisting of 112,705,508 people shows a mild negative correlation between the proportion of Bahamians and percentage of population with at least college, under 1 year education in the United States with a correlation coefficient (R) of -0.379 and weighted average of 60.3%, a difference of 4.8%.
College, Under 1 year Correlation Summary
| Measurement | Immigrants from Peru | Bahamian |
| Minimum | 28.8% | 17.1% |
| Maximum | 89.8% | 82.8% |
| Range | 61.0% | 65.7% |
| Mean | 58.9% | 53.5% |
| Median | 61.6% | 55.5% |
| Interquartile 25% (IQ1) | 50.5% | 45.7% |
| Interquartile 75% (IQ3) | 65.7% | 62.4% |
| Interquartile Range (IQR) | 15.3% | 16.7% |
| Standard Deviation (Sample) | 11.6% | 13.8% |
| Standard Deviation (Population) | 11.6% | 13.7% |
Similar Demographics by College, Under 1 year
Demographics Similar to Immigrants from Peru by College, Under 1 year
In terms of college, under 1 year, the demographic groups most similar to Immigrants from Peru are Immigrants from Colombia (63.1%, a difference of 0.020%), Subsaharan African (63.2%, a difference of 0.10%), Immigrants from Ghana (63.1%, a difference of 0.11%), Immigrants from Costa Rica (63.2%, a difference of 0.13%), and Samoan (63.0%, a difference of 0.22%).
| Demographics | Rating | Rank | College, Under 1 year |
| Immigrants | Panama | 5.7 /100 | #218 | Tragic 63.4% |
| Immigrants | Fiji | 5.7 /100 | #219 | Tragic 63.4% |
| Portuguese | 5.6 /100 | #220 | Tragic 63.4% |
| Cree | 5.2 /100 | #221 | Tragic 63.3% |
| Immigrants | Senegal | 5.0 /100 | #222 | Tragic 63.3% |
| Immigrants | Costa Rica | 4.5 /100 | #223 | Tragic 63.2% |
| Sub-Saharan Africans | 4.4 /100 | #224 | Tragic 63.2% |
| Immigrants | Peru | 4.0 /100 | #225 | Tragic 63.1% |
| Immigrants | Colombia | 4.0 /100 | #226 | Tragic 63.1% |
| Immigrants | Ghana | 3.7 /100 | #227 | Tragic 63.1% |
| Samoans | 3.3 /100 | #228 | Tragic 63.0% |
| Liberians | 3.2 /100 | #229 | Tragic 63.0% |
| Immigrants | Nonimmigrants | 3.0 /100 | #230 | Tragic 62.9% |
| Immigrants | Western Africa | 2.4 /100 | #231 | Tragic 62.8% |
| Osage | 2.2 /100 | #232 | Tragic 62.7% |
Demographics Similar to Bahamians by College, Under 1 year
In terms of college, under 1 year, the demographic groups most similar to Bahamians are Yaqui (60.2%, a difference of 0.030%), Ute (60.2%, a difference of 0.050%), Arapaho (60.3%, a difference of 0.14%), Crow (60.2%, a difference of 0.14%), and Immigrants from Barbados (60.4%, a difference of 0.17%).
| Demographics | Rating | Rank | College, Under 1 year |
| Cheyenne | 0.1 /100 | #270 | Tragic 60.6% |
| U.S. Virgin Islanders | 0.1 /100 | #271 | Tragic 60.6% |
| Jamaicans | 0.1 /100 | #272 | Tragic 60.5% |
| Chickasaw | 0.1 /100 | #273 | Tragic 60.4% |
| Alaska Natives | 0.1 /100 | #274 | Tragic 60.4% |
| Immigrants | Barbados | 0.1 /100 | #275 | Tragic 60.4% |
| Arapaho | 0.1 /100 | #276 | Tragic 60.3% |
| Bahamians | 0.1 /100 | #277 | Tragic 60.3% |
| Yaqui | 0.1 /100 | #278 | Tragic 60.2% |
| Ute | 0.1 /100 | #279 | Tragic 60.2% |
| Crow | 0.1 /100 | #280 | Tragic 60.2% |
| Cherokee | 0.1 /100 | #281 | Tragic 60.1% |
| Belizeans | 0.1 /100 | #282 | Tragic 60.1% |
| Immigrants | Jamaica | 0.0 /100 | #283 | Tragic 59.7% |
| Immigrants | St. Vincent and the Grenadines | 0.0 /100 | #284 | Tragic 59.6% |