Yakama vs Estonian College, Under 1 year
COMPARE
Yakama
Estonian
College, Under 1 year
College, Under 1 year Comparison
Yakama
Estonians
52.6%
COLLEGE, UNDER 1 YEAR
0.0/ 100
METRIC RATING
344th/ 347
METRIC RANK
70.6%
COLLEGE, UNDER 1 YEAR
99.9/ 100
METRIC RATING
34th/ 347
METRIC RANK
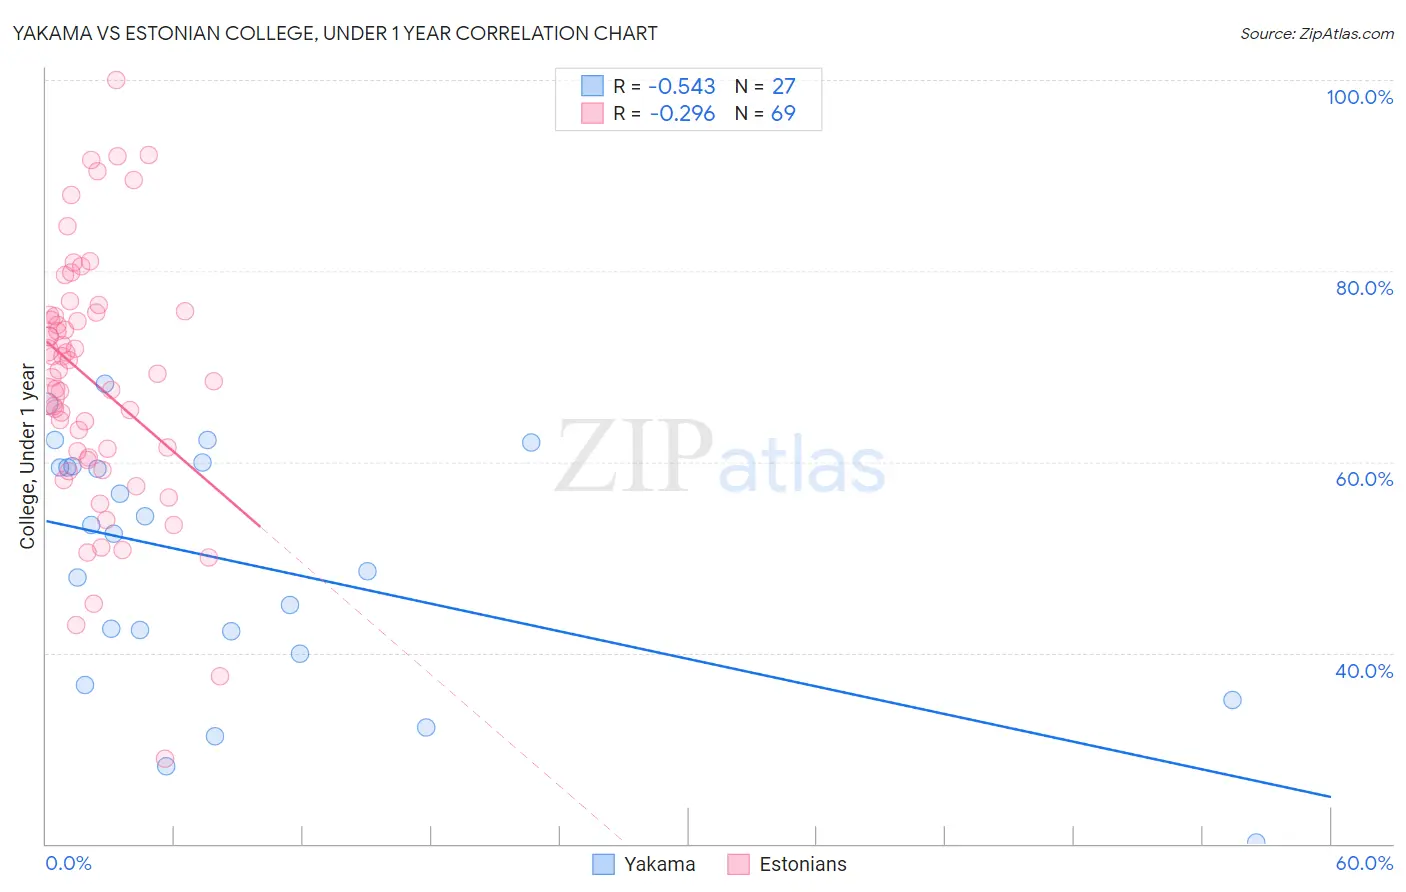
Yakama vs Estonian College, Under 1 year Correlation Chart
The statistical analysis conducted on geographies consisting of 19,923,144 people shows a substantial negative correlation between the proportion of Yakama and percentage of population with at least college, under 1 year education in the United States with a correlation coefficient (R) of -0.543 and weighted average of 52.6%. Similarly, the statistical analysis conducted on geographies consisting of 123,528,478 people shows a weak negative correlation between the proportion of Estonians and percentage of population with at least college, under 1 year education in the United States with a correlation coefficient (R) of -0.296 and weighted average of 70.6%, a difference of 34.1%.
College, Under 1 year Correlation Summary
| Measurement | Yakama | Estonian |
| Minimum | 20.2% | 28.9% |
| Maximum | 68.2% | 100.0% |
| Range | 48.1% | 71.1% |
| Mean | 49.2% | 68.4% |
| Median | 52.5% | 69.2% |
| Interquartile 25% (IQ1) | 40.0% | 60.4% |
| Interquartile 75% (IQ3) | 59.5% | 75.5% |
| Interquartile Range (IQR) | 19.6% | 15.1% |
| Standard Deviation (Sample) | 12.8% | 13.3% |
| Standard Deviation (Population) | 12.6% | 13.2% |
Similar Demographics by College, Under 1 year
Demographics Similar to Yakama by College, Under 1 year
In terms of college, under 1 year, the demographic groups most similar to Yakama are Tohono O'odham (52.8%, a difference of 0.30%), Immigrants from Mexico (53.7%, a difference of 1.9%), Immigrants from Cabo Verde (53.7%, a difference of 2.0%), Pima (51.4%, a difference of 2.4%), and Spanish American Indian (54.0%, a difference of 2.5%).
| Demographics | Rating | Rank | College, Under 1 year |
| Yuman | 0.0 /100 | #333 | Tragic 55.1% |
| Immigrants | Azores | 0.0 /100 | #334 | Tragic 54.7% |
| Inupiat | 0.0 /100 | #335 | Tragic 54.6% |
| Pennsylvania Germans | 0.0 /100 | #336 | Tragic 54.5% |
| Immigrants | Central America | 0.0 /100 | #337 | Tragic 54.4% |
| Lumbee | 0.0 /100 | #338 | Tragic 54.2% |
| Immigrants | Dominican Republic | 0.0 /100 | #339 | Tragic 54.0% |
| Spanish American Indians | 0.0 /100 | #340 | Tragic 54.0% |
| Immigrants | Cabo Verde | 0.0 /100 | #341 | Tragic 53.7% |
| Immigrants | Mexico | 0.0 /100 | #342 | Tragic 53.7% |
| Tohono O'odham | 0.0 /100 | #343 | Tragic 52.8% |
| Yakama | 0.0 /100 | #344 | Tragic 52.6% |
| Pima | 0.0 /100 | #345 | Tragic 51.4% |
| Houma | 0.0 /100 | #346 | Tragic 47.6% |
| Yup'ik | 0.0 /100 | #347 | Tragic 45.8% |
Demographics Similar to Estonians by College, Under 1 year
In terms of college, under 1 year, the demographic groups most similar to Estonians are Immigrants from South Africa (70.6%, a difference of 0.020%), Russian (70.5%, a difference of 0.080%), Immigrants from Sri Lanka (70.5%, a difference of 0.15%), Turkish (70.7%, a difference of 0.18%), and Immigrants from Saudi Arabia (70.4%, a difference of 0.26%).
| Demographics | Rating | Rank | College, Under 1 year |
| Immigrants | Ireland | 100.0 /100 | #27 | Exceptional 71.0% |
| Immigrants | Hong Kong | 100.0 /100 | #28 | Exceptional 71.0% |
| Immigrants | France | 100.0 /100 | #29 | Exceptional 71.0% |
| Immigrants | China | 99.9 /100 | #30 | Exceptional 70.9% |
| Indians (Asian) | 99.9 /100 | #31 | Exceptional 70.8% |
| Turks | 99.9 /100 | #32 | Exceptional 70.7% |
| Immigrants | South Africa | 99.9 /100 | #33 | Exceptional 70.6% |
| Estonians | 99.9 /100 | #34 | Exceptional 70.6% |
| Russians | 99.9 /100 | #35 | Exceptional 70.5% |
| Immigrants | Sri Lanka | 99.9 /100 | #36 | Exceptional 70.5% |
| Immigrants | Saudi Arabia | 99.9 /100 | #37 | Exceptional 70.4% |
| Australians | 99.9 /100 | #38 | Exceptional 70.4% |
| Bhutanese | 99.9 /100 | #39 | Exceptional 70.3% |
| Immigrants | Turkey | 99.9 /100 | #40 | Exceptional 70.3% |
| Immigrants | Kuwait | 99.9 /100 | #41 | Exceptional 70.3% |