Guyanese vs Bahamian College, Under 1 year
COMPARE
Guyanese
Bahamian
College, Under 1 year
College, Under 1 year Comparison
Guyanese
Bahamians
59.0%
COLLEGE, UNDER 1 YEAR
0.0/ 100
METRIC RATING
297th/ 347
METRIC RANK
60.3%
COLLEGE, UNDER 1 YEAR
0.1/ 100
METRIC RATING
277th/ 347
METRIC RANK
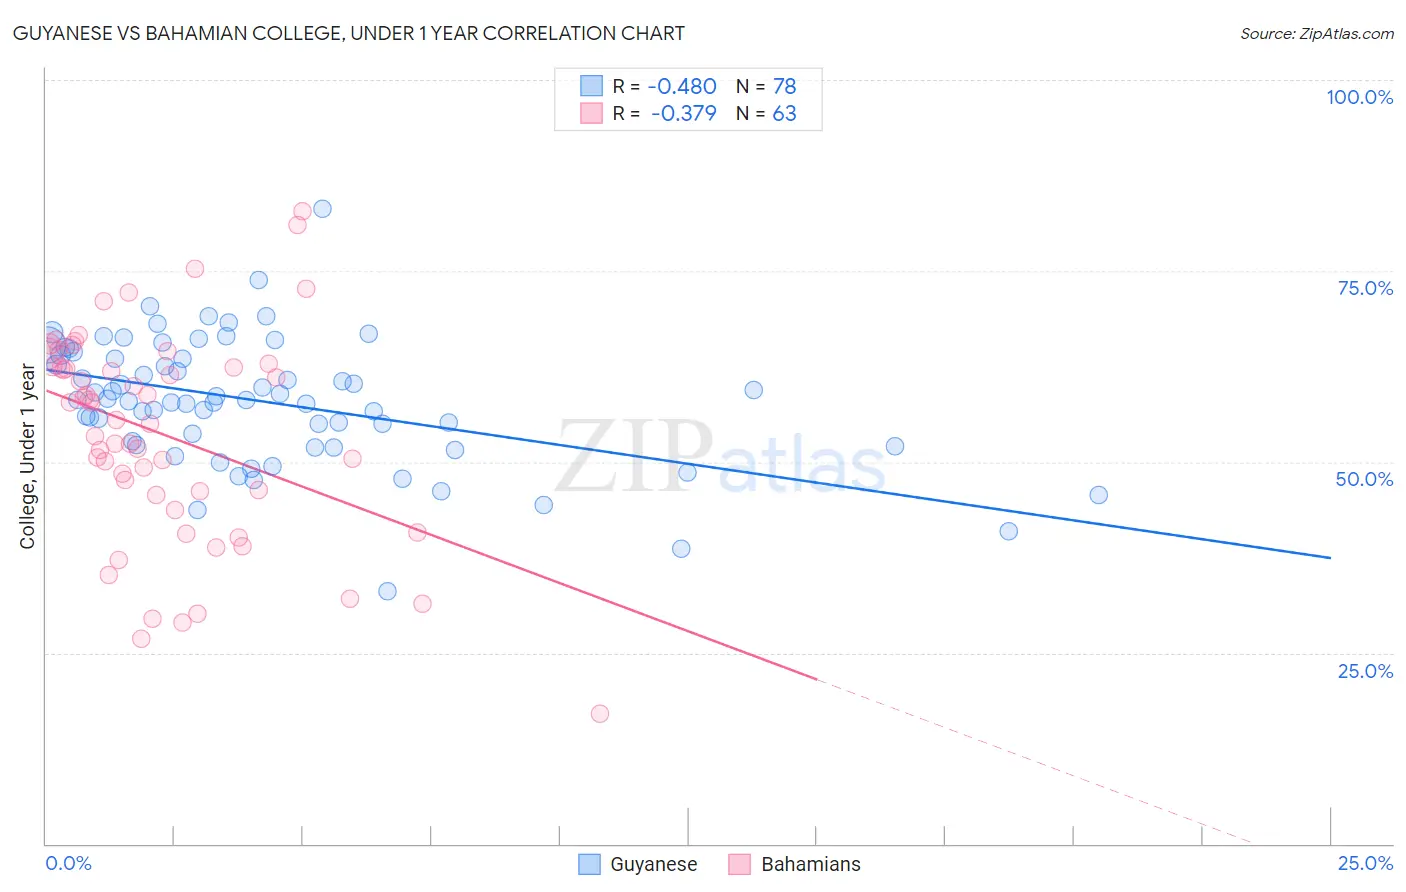
Guyanese vs Bahamian College, Under 1 year Correlation Chart
The statistical analysis conducted on geographies consisting of 176,940,589 people shows a moderate negative correlation between the proportion of Guyanese and percentage of population with at least college, under 1 year education in the United States with a correlation coefficient (R) of -0.480 and weighted average of 59.0%. Similarly, the statistical analysis conducted on geographies consisting of 112,705,508 people shows a mild negative correlation between the proportion of Bahamians and percentage of population with at least college, under 1 year education in the United States with a correlation coefficient (R) of -0.379 and weighted average of 60.3%, a difference of 2.1%.
College, Under 1 year Correlation Summary
| Measurement | Guyanese | Bahamian |
| Minimum | 33.1% | 17.1% |
| Maximum | 83.1% | 82.8% |
| Range | 50.0% | 65.7% |
| Mean | 57.9% | 53.5% |
| Median | 58.1% | 55.5% |
| Interquartile 25% (IQ1) | 52.3% | 45.7% |
| Interquartile 75% (IQ3) | 64.0% | 62.4% |
| Interquartile Range (IQR) | 11.7% | 16.7% |
| Standard Deviation (Sample) | 8.4% | 13.8% |
| Standard Deviation (Population) | 8.3% | 13.7% |
Demographics Similar to Guyanese and Bahamians by College, Under 1 year
In terms of college, under 1 year, the demographic groups most similar to Guyanese are Central American Indian (59.0%, a difference of 0.040%), Immigrants from Grenada (59.1%, a difference of 0.080%), Immigrants from Belize (59.1%, a difference of 0.19%), Seminole (59.1%, a difference of 0.21%), and Nicaraguan (59.2%, a difference of 0.39%). Similarly, the demographic groups most similar to Bahamians are Yaqui (60.2%, a difference of 0.030%), Ute (60.2%, a difference of 0.050%), Crow (60.2%, a difference of 0.14%), Cherokee (60.1%, a difference of 0.25%), and Belizean (60.1%, a difference of 0.29%).
| Demographics | Rating | Rank | College, Under 1 year |
| Bahamians | 0.1 /100 | #277 | Tragic 60.3% |
| Yaqui | 0.1 /100 | #278 | Tragic 60.2% |
| Ute | 0.1 /100 | #279 | Tragic 60.2% |
| Crow | 0.1 /100 | #280 | Tragic 60.2% |
| Cherokee | 0.1 /100 | #281 | Tragic 60.1% |
| Belizeans | 0.1 /100 | #282 | Tragic 60.1% |
| Immigrants | Jamaica | 0.0 /100 | #283 | Tragic 59.7% |
| Immigrants | St. Vincent and the Grenadines | 0.0 /100 | #284 | Tragic 59.6% |
| Paiute | 0.0 /100 | #285 | Tragic 59.6% |
| British West Indians | 0.0 /100 | #286 | Tragic 59.5% |
| Sioux | 0.0 /100 | #287 | Tragic 59.4% |
| Blacks/African Americans | 0.0 /100 | #288 | Tragic 59.4% |
| Choctaw | 0.0 /100 | #289 | Tragic 59.3% |
| Ecuadorians | 0.0 /100 | #290 | Tragic 59.3% |
| Creek | 0.0 /100 | #291 | Tragic 59.3% |
| Nicaraguans | 0.0 /100 | #292 | Tragic 59.2% |
| Seminole | 0.0 /100 | #293 | Tragic 59.1% |
| Immigrants | Belize | 0.0 /100 | #294 | Tragic 59.1% |
| Immigrants | Grenada | 0.0 /100 | #295 | Tragic 59.1% |
| Central American Indians | 0.0 /100 | #296 | Tragic 59.0% |
| Guyanese | 0.0 /100 | #297 | Tragic 59.0% |