Bhutanese vs Bahamian College, Under 1 year
COMPARE
Bhutanese
Bahamian
College, Under 1 year
College, Under 1 year Comparison
Bhutanese
Bahamians
70.3%
COLLEGE, UNDER 1 YEAR
99.9/ 100
METRIC RATING
39th/ 347
METRIC RANK
60.3%
COLLEGE, UNDER 1 YEAR
0.1/ 100
METRIC RATING
277th/ 347
METRIC RANK
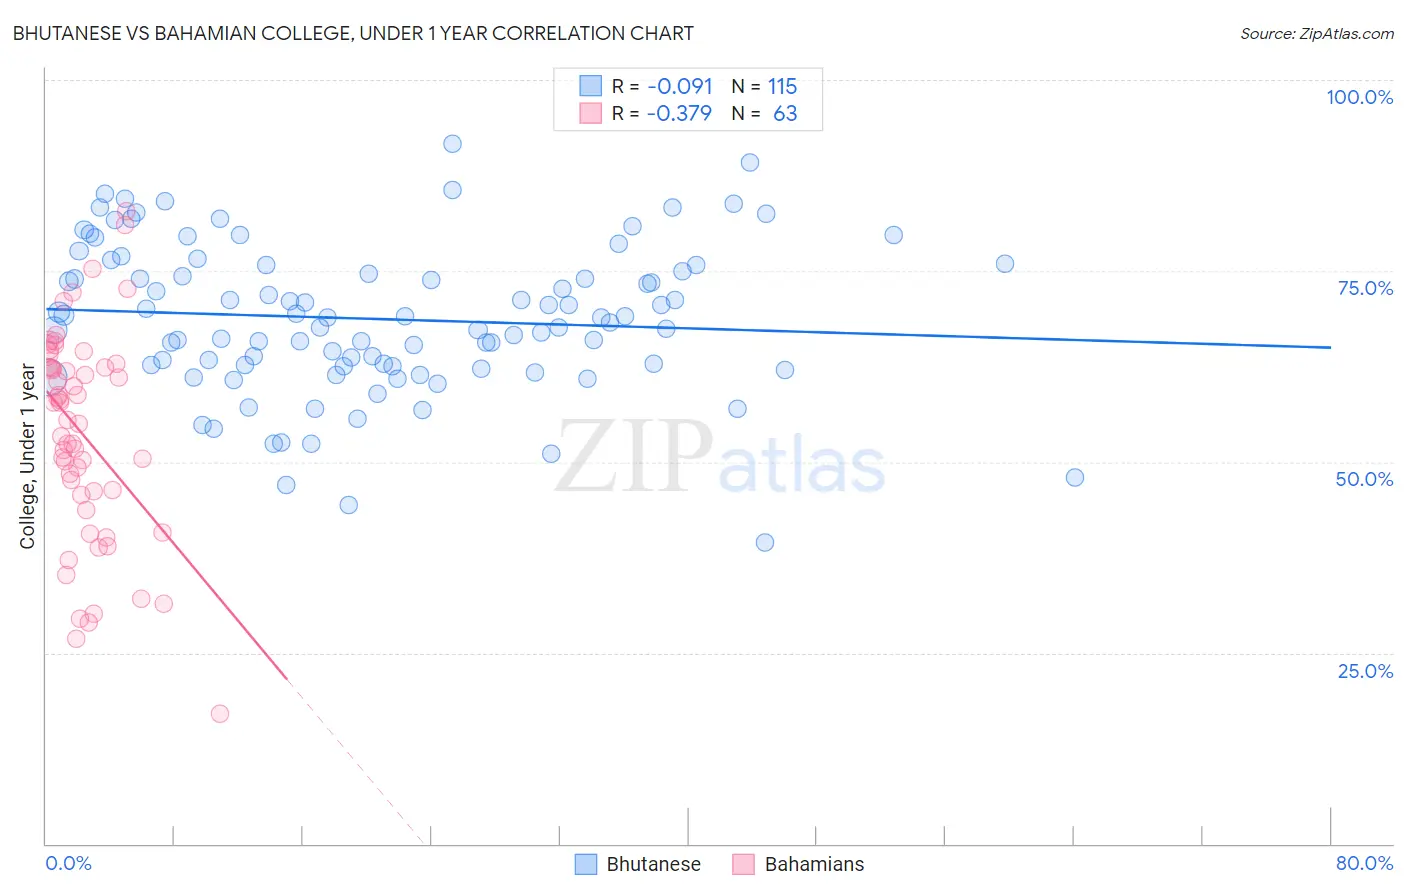
Bhutanese vs Bahamian College, Under 1 year Correlation Chart
The statistical analysis conducted on geographies consisting of 455,589,094 people shows a slight negative correlation between the proportion of Bhutanese and percentage of population with at least college, under 1 year education in the United States with a correlation coefficient (R) of -0.091 and weighted average of 70.3%. Similarly, the statistical analysis conducted on geographies consisting of 112,705,508 people shows a mild negative correlation between the proportion of Bahamians and percentage of population with at least college, under 1 year education in the United States with a correlation coefficient (R) of -0.379 and weighted average of 60.3%, a difference of 16.7%.
College, Under 1 year Correlation Summary
| Measurement | Bhutanese | Bahamian |
| Minimum | 39.5% | 17.1% |
| Maximum | 91.6% | 82.8% |
| Range | 52.1% | 65.7% |
| Mean | 68.7% | 53.5% |
| Median | 68.9% | 55.5% |
| Interquartile 25% (IQ1) | 62.6% | 45.7% |
| Interquartile 75% (IQ3) | 75.7% | 62.4% |
| Interquartile Range (IQR) | 13.1% | 16.7% |
| Standard Deviation (Sample) | 9.9% | 13.8% |
| Standard Deviation (Population) | 9.8% | 13.7% |
Similar Demographics by College, Under 1 year
Demographics Similar to Bhutanese by College, Under 1 year
In terms of college, under 1 year, the demographic groups most similar to Bhutanese are Immigrants from Turkey (70.3%, a difference of 0.010%), Australian (70.4%, a difference of 0.020%), Immigrants from Kuwait (70.3%, a difference of 0.050%), Immigrants from Saudi Arabia (70.4%, a difference of 0.090%), and Immigrants from Lithuania (70.3%, a difference of 0.10%).
| Demographics | Rating | Rank | College, Under 1 year |
| Turks | 99.9 /100 | #32 | Exceptional 70.7% |
| Immigrants | South Africa | 99.9 /100 | #33 | Exceptional 70.6% |
| Estonians | 99.9 /100 | #34 | Exceptional 70.6% |
| Russians | 99.9 /100 | #35 | Exceptional 70.5% |
| Immigrants | Sri Lanka | 99.9 /100 | #36 | Exceptional 70.5% |
| Immigrants | Saudi Arabia | 99.9 /100 | #37 | Exceptional 70.4% |
| Australians | 99.9 /100 | #38 | Exceptional 70.4% |
| Bhutanese | 99.9 /100 | #39 | Exceptional 70.3% |
| Immigrants | Turkey | 99.9 /100 | #40 | Exceptional 70.3% |
| Immigrants | Kuwait | 99.9 /100 | #41 | Exceptional 70.3% |
| Immigrants | Lithuania | 99.9 /100 | #42 | Exceptional 70.3% |
| Israelis | 99.9 /100 | #43 | Exceptional 70.2% |
| New Zealanders | 99.9 /100 | #44 | Exceptional 70.2% |
| Immigrants | Norway | 99.9 /100 | #45 | Exceptional 70.2% |
| Immigrants | Latvia | 99.9 /100 | #46 | Exceptional 70.1% |
Demographics Similar to Bahamians by College, Under 1 year
In terms of college, under 1 year, the demographic groups most similar to Bahamians are Yaqui (60.2%, a difference of 0.030%), Ute (60.2%, a difference of 0.050%), Arapaho (60.3%, a difference of 0.14%), Crow (60.2%, a difference of 0.14%), and Immigrants from Barbados (60.4%, a difference of 0.17%).
| Demographics | Rating | Rank | College, Under 1 year |
| Cheyenne | 0.1 /100 | #270 | Tragic 60.6% |
| U.S. Virgin Islanders | 0.1 /100 | #271 | Tragic 60.6% |
| Jamaicans | 0.1 /100 | #272 | Tragic 60.5% |
| Chickasaw | 0.1 /100 | #273 | Tragic 60.4% |
| Alaska Natives | 0.1 /100 | #274 | Tragic 60.4% |
| Immigrants | Barbados | 0.1 /100 | #275 | Tragic 60.4% |
| Arapaho | 0.1 /100 | #276 | Tragic 60.3% |
| Bahamians | 0.1 /100 | #277 | Tragic 60.3% |
| Yaqui | 0.1 /100 | #278 | Tragic 60.2% |
| Ute | 0.1 /100 | #279 | Tragic 60.2% |
| Crow | 0.1 /100 | #280 | Tragic 60.2% |
| Cherokee | 0.1 /100 | #281 | Tragic 60.1% |
| Belizeans | 0.1 /100 | #282 | Tragic 60.1% |
| Immigrants | Jamaica | 0.0 /100 | #283 | Tragic 59.7% |
| Immigrants | St. Vincent and the Grenadines | 0.0 /100 | #284 | Tragic 59.6% |