Yakama vs Norwegian College, Under 1 year
COMPARE
Yakama
Norwegian
College, Under 1 year
College, Under 1 year Comparison
Yakama
Norwegians
52.6%
COLLEGE, UNDER 1 YEAR
0.0/ 100
METRIC RATING
344th/ 347
METRIC RANK
68.4%
COLLEGE, UNDER 1 YEAR
98.4/ 100
METRIC RATING
82nd/ 347
METRIC RANK
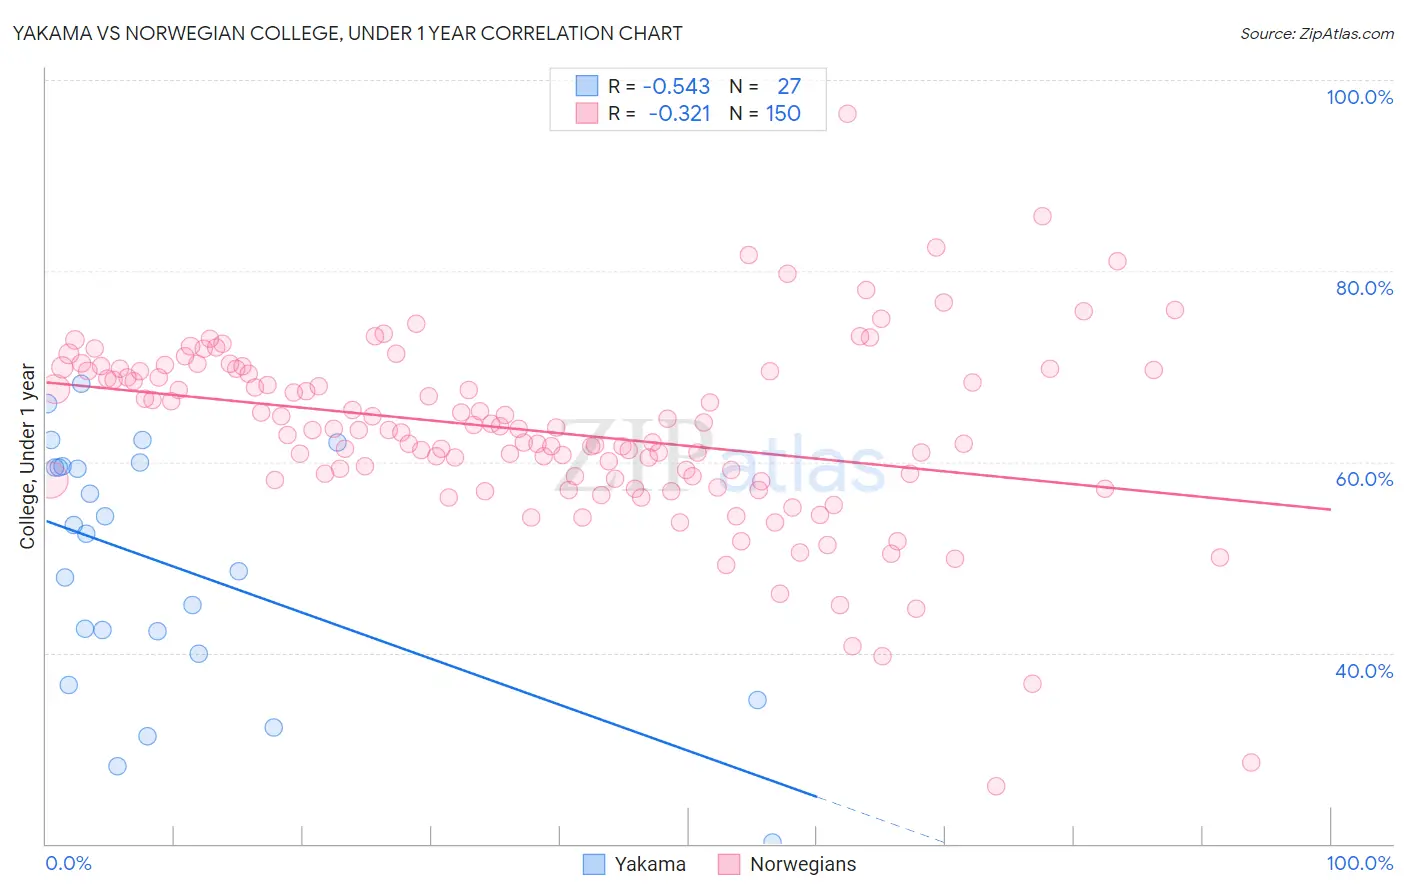
Yakama vs Norwegian College, Under 1 year Correlation Chart
The statistical analysis conducted on geographies consisting of 19,923,144 people shows a substantial negative correlation between the proportion of Yakama and percentage of population with at least college, under 1 year education in the United States with a correlation coefficient (R) of -0.543 and weighted average of 52.6%. Similarly, the statistical analysis conducted on geographies consisting of 533,391,768 people shows a mild negative correlation between the proportion of Norwegians and percentage of population with at least college, under 1 year education in the United States with a correlation coefficient (R) of -0.321 and weighted average of 68.4%, a difference of 29.9%.
College, Under 1 year Correlation Summary
| Measurement | Yakama | Norwegian |
| Minimum | 20.2% | 26.1% |
| Maximum | 68.2% | 96.4% |
| Range | 48.1% | 70.3% |
| Mean | 49.2% | 63.2% |
| Median | 52.5% | 63.4% |
| Interquartile 25% (IQ1) | 40.0% | 58.2% |
| Interquartile 75% (IQ3) | 59.5% | 69.6% |
| Interquartile Range (IQR) | 19.6% | 11.3% |
| Standard Deviation (Sample) | 12.8% | 9.7% |
| Standard Deviation (Population) | 12.6% | 9.7% |
Similar Demographics by College, Under 1 year
Demographics Similar to Yakama by College, Under 1 year
In terms of college, under 1 year, the demographic groups most similar to Yakama are Tohono O'odham (52.8%, a difference of 0.30%), Immigrants from Mexico (53.7%, a difference of 1.9%), Immigrants from Cabo Verde (53.7%, a difference of 2.0%), Pima (51.4%, a difference of 2.4%), and Spanish American Indian (54.0%, a difference of 2.5%).
| Demographics | Rating | Rank | College, Under 1 year |
| Yuman | 0.0 /100 | #333 | Tragic 55.1% |
| Immigrants | Azores | 0.0 /100 | #334 | Tragic 54.7% |
| Inupiat | 0.0 /100 | #335 | Tragic 54.6% |
| Pennsylvania Germans | 0.0 /100 | #336 | Tragic 54.5% |
| Immigrants | Central America | 0.0 /100 | #337 | Tragic 54.4% |
| Lumbee | 0.0 /100 | #338 | Tragic 54.2% |
| Immigrants | Dominican Republic | 0.0 /100 | #339 | Tragic 54.0% |
| Spanish American Indians | 0.0 /100 | #340 | Tragic 54.0% |
| Immigrants | Cabo Verde | 0.0 /100 | #341 | Tragic 53.7% |
| Immigrants | Mexico | 0.0 /100 | #342 | Tragic 53.7% |
| Tohono O'odham | 0.0 /100 | #343 | Tragic 52.8% |
| Yakama | 0.0 /100 | #344 | Tragic 52.6% |
| Pima | 0.0 /100 | #345 | Tragic 51.4% |
| Houma | 0.0 /100 | #346 | Tragic 47.6% |
| Yup'ik | 0.0 /100 | #347 | Tragic 45.8% |
Demographics Similar to Norwegians by College, Under 1 year
In terms of college, under 1 year, the demographic groups most similar to Norwegians are Argentinean (68.4%, a difference of 0.020%), Immigrants from Hungary (68.3%, a difference of 0.040%), Egyptian (68.3%, a difference of 0.040%), Immigrants from Greece (68.4%, a difference of 0.050%), and Immigrants from Lebanon (68.3%, a difference of 0.050%).
| Demographics | Rating | Rank | College, Under 1 year |
| Immigrants | Western Europe | 98.6 /100 | #75 | Exceptional 68.5% |
| Laotians | 98.6 /100 | #76 | Exceptional 68.5% |
| British | 98.6 /100 | #77 | Exceptional 68.5% |
| Danes | 98.6 /100 | #78 | Exceptional 68.5% |
| Greeks | 98.6 /100 | #79 | Exceptional 68.5% |
| Immigrants | Spain | 98.5 /100 | #80 | Exceptional 68.4% |
| Immigrants | Greece | 98.5 /100 | #81 | Exceptional 68.4% |
| Norwegians | 98.4 /100 | #82 | Exceptional 68.4% |
| Argentineans | 98.4 /100 | #83 | Exceptional 68.4% |
| Immigrants | Hungary | 98.3 /100 | #84 | Exceptional 68.3% |
| Egyptians | 98.3 /100 | #85 | Exceptional 68.3% |
| Immigrants | Lebanon | 98.3 /100 | #86 | Exceptional 68.3% |
| Chinese | 98.3 /100 | #87 | Exceptional 68.3% |
| Croatians | 98.2 /100 | #88 | Exceptional 68.3% |
| Ethiopians | 98.2 /100 | #89 | Exceptional 68.3% |