White/Caucasian vs West Indian Doctorate Degree
COMPARE
White/Caucasian
West Indian
Doctorate Degree
Doctorate Degree Comparison
Whites/Caucasians
West Indians
1.8%
DOCTORATE DEGREE
22.8/ 100
METRIC RATING
200th/ 347
METRIC RANK
1.6%
DOCTORATE DEGREE
2.5/ 100
METRIC RATING
239th/ 347
METRIC RANK
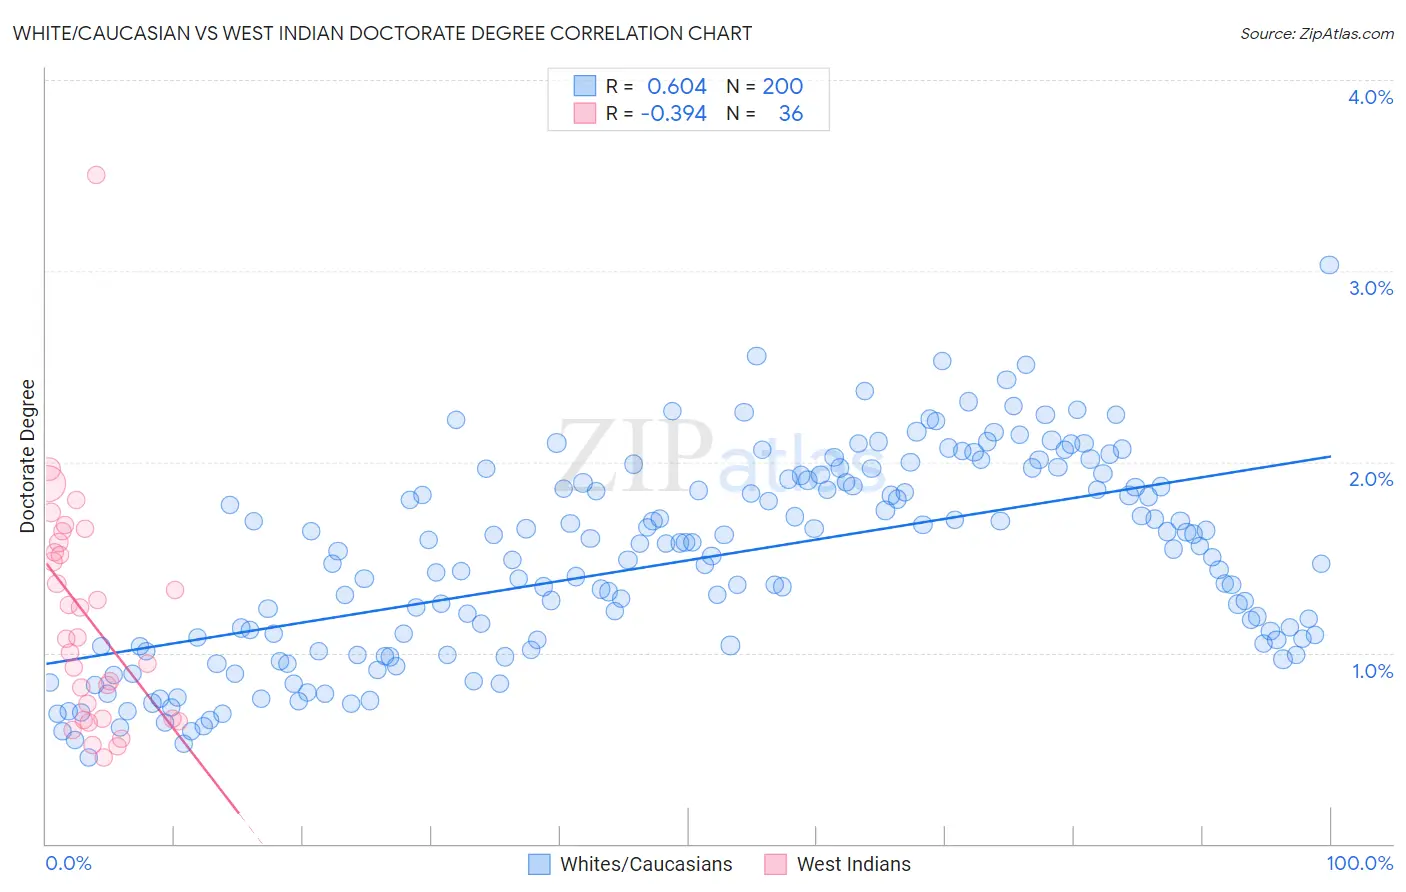
White/Caucasian vs West Indian Doctorate Degree Correlation Chart
The statistical analysis conducted on geographies consisting of 553,713,140 people shows a significant positive correlation between the proportion of Whites/Caucasians and percentage of population with at least doctorate degree education in the United States with a correlation coefficient (R) of 0.604 and weighted average of 1.8%. Similarly, the statistical analysis conducted on geographies consisting of 252,865,047 people shows a mild negative correlation between the proportion of West Indians and percentage of population with at least doctorate degree education in the United States with a correlation coefficient (R) of -0.394 and weighted average of 1.6%, a difference of 10.3%.
Doctorate Degree Correlation Summary
| Measurement | White/Caucasian | West Indian |
| Minimum | 0.45% | 0.45% |
| Maximum | 3.0% | 3.5% |
| Range | 2.6% | 3.0% |
| Mean | 1.5% | 1.2% |
| Median | 1.5% | 1.1% |
| Interquartile 25% (IQ1) | 1.0% | 0.65% |
| Interquartile 75% (IQ3) | 1.9% | 1.6% |
| Interquartile Range (IQR) | 0.85% | 0.90% |
| Standard Deviation (Sample) | 0.52% | 0.60% |
| Standard Deviation (Population) | 0.52% | 0.59% |
Similar Demographics by Doctorate Degree
Demographics Similar to Whites/Caucasians by Doctorate Degree
In terms of doctorate degree, the demographic groups most similar to Whites/Caucasians are Immigrants from Nigeria (1.8%, a difference of 0.070%), Immigrants from South America (1.8%, a difference of 0.11%), Portuguese (1.8%, a difference of 0.29%), Immigrants from Vietnam (1.8%, a difference of 0.32%), and Somali (1.7%, a difference of 0.35%).
| Demographics | Rating | Rank | Doctorate Degree |
| German Russians | 27.1 /100 | #193 | Fair 1.8% |
| Uruguayans | 26.2 /100 | #194 | Fair 1.8% |
| Immigrants | Somalia | 25.4 /100 | #195 | Fair 1.8% |
| Sub-Saharan Africans | 25.1 /100 | #196 | Fair 1.8% |
| Chinese | 25.1 /100 | #197 | Fair 1.8% |
| Immigrants | Ghana | 24.6 /100 | #198 | Fair 1.8% |
| Immigrants | South America | 23.3 /100 | #199 | Fair 1.8% |
| Whites/Caucasians | 22.8 /100 | #200 | Fair 1.8% |
| Immigrants | Nigeria | 22.4 /100 | #201 | Fair 1.8% |
| Portuguese | 21.4 /100 | #202 | Fair 1.8% |
| Immigrants | Vietnam | 21.4 /100 | #203 | Fair 1.8% |
| Somalis | 21.2 /100 | #204 | Fair 1.7% |
| Venezuelans | 19.5 /100 | #205 | Poor 1.7% |
| Immigrants | Peru | 17.6 /100 | #206 | Poor 1.7% |
| Yugoslavians | 17.1 /100 | #207 | Poor 1.7% |
Demographics Similar to West Indians by Doctorate Degree
In terms of doctorate degree, the demographic groups most similar to West Indians are Immigrants from Congo (1.6%, a difference of 0.10%), Immigrants from Panama (1.6%, a difference of 0.19%), Iroquois (1.6%, a difference of 0.31%), Cheyenne (1.6%, a difference of 0.38%), and Indonesian (1.6%, a difference of 0.50%).
| Demographics | Rating | Rank | Doctorate Degree |
| Guamanians/Chamorros | 3.3 /100 | #232 | Tragic 1.6% |
| Barbadians | 3.3 /100 | #233 | Tragic 1.6% |
| Hopi | 3.2 /100 | #234 | Tragic 1.6% |
| Cree | 3.0 /100 | #235 | Tragic 1.6% |
| Indonesians | 2.8 /100 | #236 | Tragic 1.6% |
| Iroquois | 2.7 /100 | #237 | Tragic 1.6% |
| Immigrants | Congo | 2.6 /100 | #238 | Tragic 1.6% |
| West Indians | 2.5 /100 | #239 | Tragic 1.6% |
| Immigrants | Panama | 2.4 /100 | #240 | Tragic 1.6% |
| Cheyenne | 2.3 /100 | #241 | Tragic 1.6% |
| Ottawa | 2.2 /100 | #242 | Tragic 1.6% |
| Native Hawaiians | 2.1 /100 | #243 | Tragic 1.6% |
| French American Indians | 2.0 /100 | #244 | Tragic 1.6% |
| Delaware | 1.9 /100 | #245 | Tragic 1.6% |
| Hmong | 1.8 /100 | #246 | Tragic 1.6% |