Norwegian vs West Indian Doctorate Degree
COMPARE
Norwegian
West Indian
Doctorate Degree
Doctorate Degree Comparison
Norwegians
West Indians
1.8%
DOCTORATE DEGREE
50.0/ 100
METRIC RATING
173rd/ 347
METRIC RANK
1.6%
DOCTORATE DEGREE
2.5/ 100
METRIC RATING
239th/ 347
METRIC RANK
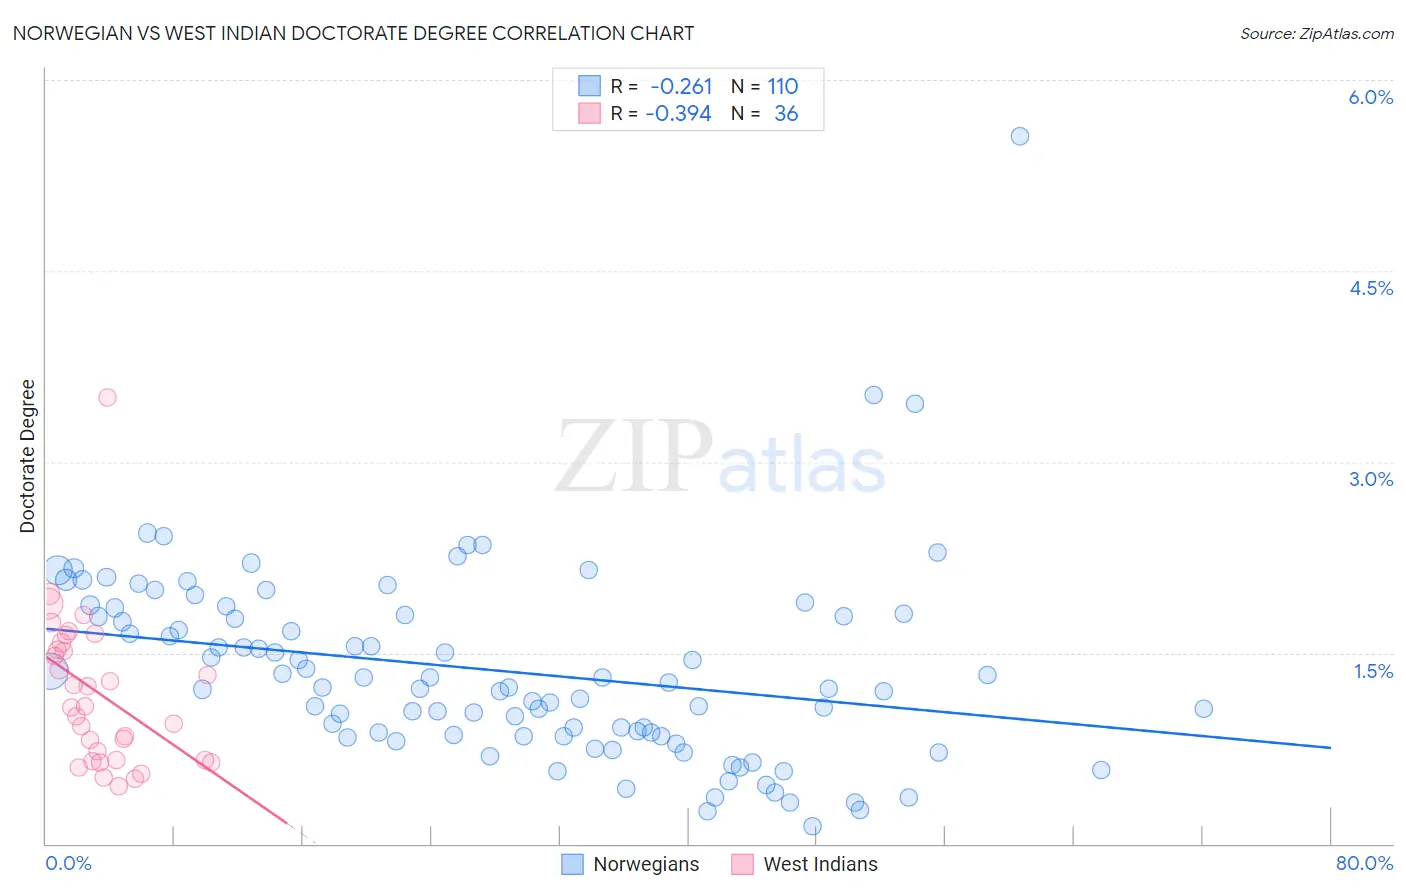
Norwegian vs West Indian Doctorate Degree Correlation Chart
The statistical analysis conducted on geographies consisting of 517,125,793 people shows a weak negative correlation between the proportion of Norwegians and percentage of population with at least doctorate degree education in the United States with a correlation coefficient (R) of -0.261 and weighted average of 1.8%. Similarly, the statistical analysis conducted on geographies consisting of 252,865,047 people shows a mild negative correlation between the proportion of West Indians and percentage of population with at least doctorate degree education in the United States with a correlation coefficient (R) of -0.394 and weighted average of 1.6%, a difference of 15.5%.
Doctorate Degree Correlation Summary
| Measurement | Norwegian | West Indian |
| Minimum | 0.14% | 0.45% |
| Maximum | 5.6% | 3.5% |
| Range | 5.4% | 3.0% |
| Mean | 1.4% | 1.2% |
| Median | 1.2% | 1.1% |
| Interquartile 25% (IQ1) | 0.85% | 0.65% |
| Interquartile 75% (IQ3) | 1.8% | 1.6% |
| Interquartile Range (IQR) | 0.95% | 0.90% |
| Standard Deviation (Sample) | 0.76% | 0.60% |
| Standard Deviation (Population) | 0.76% | 0.59% |
Similar Demographics by Doctorate Degree
Demographics Similar to Norwegians by Doctorate Degree
In terms of doctorate degree, the demographic groups most similar to Norwegians are Immigrants from Bangladesh (1.8%, a difference of 0.0%), Belgian (1.8%, a difference of 0.040%), Immigrants from Thailand (1.8%, a difference of 0.090%), Spanish (1.8%, a difference of 0.10%), and Iraqi (1.8%, a difference of 0.12%).
| Demographics | Rating | Rank | Doctorate Degree |
| Spaniards | 63.5 /100 | #166 | Good 1.9% |
| Macedonians | 60.9 /100 | #167 | Good 1.9% |
| Sri Lankans | 60.3 /100 | #168 | Good 1.9% |
| Vietnamese | 54.8 /100 | #169 | Average 1.9% |
| Costa Ricans | 53.3 /100 | #170 | Average 1.8% |
| Bermudans | 52.1 /100 | #171 | Average 1.8% |
| Belgians | 50.3 /100 | #172 | Average 1.8% |
| Norwegians | 50.0 /100 | #173 | Average 1.8% |
| Immigrants | Bangladesh | 50.0 /100 | #174 | Average 1.8% |
| Immigrants | Thailand | 49.4 /100 | #175 | Average 1.8% |
| Spanish | 49.3 /100 | #176 | Average 1.8% |
| Iraqis | 49.2 /100 | #177 | Average 1.8% |
| French | 48.8 /100 | #178 | Average 1.8% |
| Ghanaians | 48.3 /100 | #179 | Average 1.8% |
| Scandinavians | 48.0 /100 | #180 | Average 1.8% |
Demographics Similar to West Indians by Doctorate Degree
In terms of doctorate degree, the demographic groups most similar to West Indians are Immigrants from Congo (1.6%, a difference of 0.10%), Immigrants from Panama (1.6%, a difference of 0.19%), Iroquois (1.6%, a difference of 0.31%), Cheyenne (1.6%, a difference of 0.38%), and Indonesian (1.6%, a difference of 0.50%).
| Demographics | Rating | Rank | Doctorate Degree |
| Guamanians/Chamorros | 3.3 /100 | #232 | Tragic 1.6% |
| Barbadians | 3.3 /100 | #233 | Tragic 1.6% |
| Hopi | 3.2 /100 | #234 | Tragic 1.6% |
| Cree | 3.0 /100 | #235 | Tragic 1.6% |
| Indonesians | 2.8 /100 | #236 | Tragic 1.6% |
| Iroquois | 2.7 /100 | #237 | Tragic 1.6% |
| Immigrants | Congo | 2.6 /100 | #238 | Tragic 1.6% |
| West Indians | 2.5 /100 | #239 | Tragic 1.6% |
| Immigrants | Panama | 2.4 /100 | #240 | Tragic 1.6% |
| Cheyenne | 2.3 /100 | #241 | Tragic 1.6% |
| Ottawa | 2.2 /100 | #242 | Tragic 1.6% |
| Native Hawaiians | 2.1 /100 | #243 | Tragic 1.6% |
| French American Indians | 2.0 /100 | #244 | Tragic 1.6% |
| Delaware | 1.9 /100 | #245 | Tragic 1.6% |
| Hmong | 1.8 /100 | #246 | Tragic 1.6% |