Immigrants from Guyana vs West Indian Doctorate Degree
COMPARE
Immigrants from Guyana
West Indian
Doctorate Degree
Doctorate Degree Comparison
Immigrants from Guyana
West Indians
1.3%
DOCTORATE DEGREE
0.1/ 100
METRIC RATING
319th/ 347
METRIC RANK
1.6%
DOCTORATE DEGREE
2.5/ 100
METRIC RATING
239th/ 347
METRIC RANK
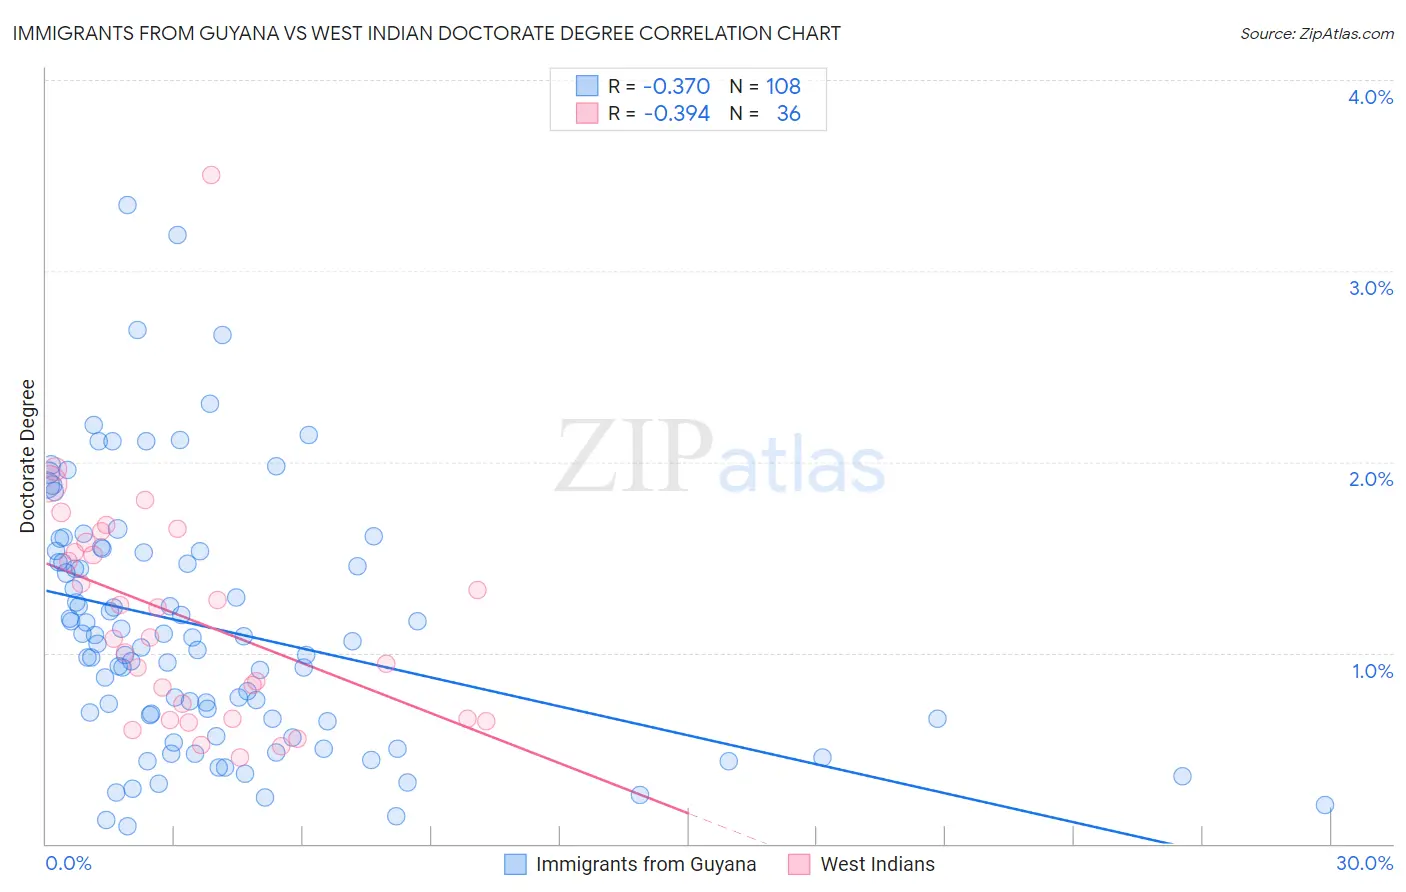
Immigrants from Guyana vs West Indian Doctorate Degree Correlation Chart
The statistical analysis conducted on geographies consisting of 183,107,969 people shows a mild negative correlation between the proportion of Immigrants from Guyana and percentage of population with at least doctorate degree education in the United States with a correlation coefficient (R) of -0.370 and weighted average of 1.3%. Similarly, the statistical analysis conducted on geographies consisting of 252,865,047 people shows a mild negative correlation between the proportion of West Indians and percentage of population with at least doctorate degree education in the United States with a correlation coefficient (R) of -0.394 and weighted average of 1.6%, a difference of 19.4%.
Doctorate Degree Correlation Summary
| Measurement | Immigrants from Guyana | West Indian |
| Minimum | 0.090% | 0.45% |
| Maximum | 3.3% | 3.5% |
| Range | 3.3% | 3.0% |
| Mean | 1.1% | 1.2% |
| Median | 1.1% | 1.1% |
| Interquartile 25% (IQ1) | 0.65% | 0.65% |
| Interquartile 75% (IQ3) | 1.5% | 1.6% |
| Interquartile Range (IQR) | 0.88% | 0.90% |
| Standard Deviation (Sample) | 0.66% | 0.60% |
| Standard Deviation (Population) | 0.66% | 0.59% |
Similar Demographics by Doctorate Degree
Demographics Similar to Immigrants from Guyana by Doctorate Degree
In terms of doctorate degree, the demographic groups most similar to Immigrants from Guyana are Immigrants from St. Vincent and the Grenadines (1.3%, a difference of 0.060%), Dutch West Indian (1.3%, a difference of 0.17%), Seminole (1.3%, a difference of 0.23%), Immigrants from Belize (1.3%, a difference of 0.43%), and Native/Alaskan (1.3%, a difference of 0.75%).
| Demographics | Rating | Rank | Doctorate Degree |
| Immigrants | Nicaragua | 0.1 /100 | #312 | Tragic 1.4% |
| Menominee | 0.1 /100 | #313 | Tragic 1.4% |
| Dominicans | 0.1 /100 | #314 | Tragic 1.4% |
| Immigrants | Azores | 0.1 /100 | #315 | Tragic 1.4% |
| Navajo | 0.1 /100 | #316 | Tragic 1.4% |
| Immigrants | Micronesia | 0.1 /100 | #317 | Tragic 1.3% |
| Creek | 0.1 /100 | #318 | Tragic 1.3% |
| Immigrants | Guyana | 0.1 /100 | #319 | Tragic 1.3% |
| Immigrants | St. Vincent and the Grenadines | 0.1 /100 | #320 | Tragic 1.3% |
| Dutch West Indians | 0.1 /100 | #321 | Tragic 1.3% |
| Seminole | 0.1 /100 | #322 | Tragic 1.3% |
| Immigrants | Belize | 0.1 /100 | #323 | Tragic 1.3% |
| Natives/Alaskans | 0.0 /100 | #324 | Tragic 1.3% |
| Pima | 0.0 /100 | #325 | Tragic 1.3% |
| Immigrants | Cabo Verde | 0.0 /100 | #326 | Tragic 1.3% |
Demographics Similar to West Indians by Doctorate Degree
In terms of doctorate degree, the demographic groups most similar to West Indians are Immigrants from Congo (1.6%, a difference of 0.10%), Immigrants from Panama (1.6%, a difference of 0.19%), Iroquois (1.6%, a difference of 0.31%), Cheyenne (1.6%, a difference of 0.38%), and Indonesian (1.6%, a difference of 0.50%).
| Demographics | Rating | Rank | Doctorate Degree |
| Guamanians/Chamorros | 3.3 /100 | #232 | Tragic 1.6% |
| Barbadians | 3.3 /100 | #233 | Tragic 1.6% |
| Hopi | 3.2 /100 | #234 | Tragic 1.6% |
| Cree | 3.0 /100 | #235 | Tragic 1.6% |
| Indonesians | 2.8 /100 | #236 | Tragic 1.6% |
| Iroquois | 2.7 /100 | #237 | Tragic 1.6% |
| Immigrants | Congo | 2.6 /100 | #238 | Tragic 1.6% |
| West Indians | 2.5 /100 | #239 | Tragic 1.6% |
| Immigrants | Panama | 2.4 /100 | #240 | Tragic 1.6% |
| Cheyenne | 2.3 /100 | #241 | Tragic 1.6% |
| Ottawa | 2.2 /100 | #242 | Tragic 1.6% |
| Native Hawaiians | 2.1 /100 | #243 | Tragic 1.6% |
| French American Indians | 2.0 /100 | #244 | Tragic 1.6% |
| Delaware | 1.9 /100 | #245 | Tragic 1.6% |
| Hmong | 1.8 /100 | #246 | Tragic 1.6% |