Marshallese vs West Indian Doctorate Degree
COMPARE
Marshallese
West Indian
Doctorate Degree
Doctorate Degree Comparison
Marshallese
West Indians
1.5%
DOCTORATE DEGREE
0.4/ 100
METRIC RATING
279th/ 347
METRIC RANK
1.6%
DOCTORATE DEGREE
2.5/ 100
METRIC RATING
239th/ 347
METRIC RANK
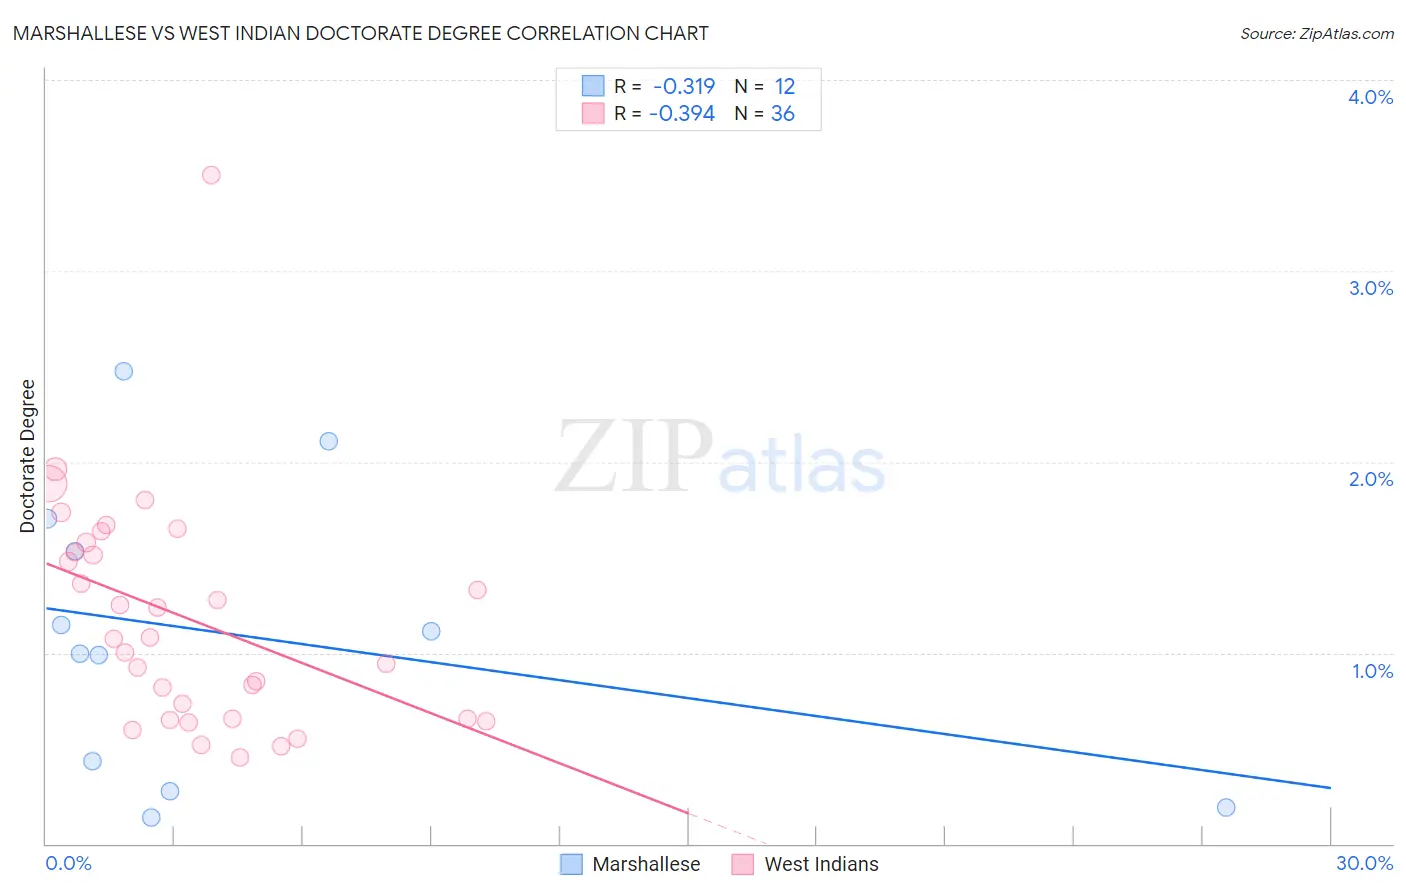
Marshallese vs West Indian Doctorate Degree Correlation Chart
The statistical analysis conducted on geographies consisting of 14,742,598 people shows a mild negative correlation between the proportion of Marshallese and percentage of population with at least doctorate degree education in the United States with a correlation coefficient (R) of -0.319 and weighted average of 1.5%. Similarly, the statistical analysis conducted on geographies consisting of 252,865,047 people shows a mild negative correlation between the proportion of West Indians and percentage of population with at least doctorate degree education in the United States with a correlation coefficient (R) of -0.394 and weighted average of 1.6%, a difference of 9.1%.
Doctorate Degree Correlation Summary
| Measurement | Marshallese | West Indian |
| Minimum | 0.14% | 0.45% |
| Maximum | 2.5% | 3.5% |
| Range | 2.3% | 3.0% |
| Mean | 1.1% | 1.2% |
| Median | 1.1% | 1.1% |
| Interquartile 25% (IQ1) | 0.35% | 0.65% |
| Interquartile 75% (IQ3) | 1.6% | 1.6% |
| Interquartile Range (IQR) | 1.3% | 0.90% |
| Standard Deviation (Sample) | 0.76% | 0.60% |
| Standard Deviation (Population) | 0.73% | 0.59% |
Similar Demographics by Doctorate Degree
Demographics Similar to Marshallese by Doctorate Degree
In terms of doctorate degree, the demographic groups most similar to Marshallese are Ecuadorian (1.5%, a difference of 0.010%), Tohono O'odham (1.5%, a difference of 0.080%), British West Indian (1.5%, a difference of 0.13%), Central American (1.5%, a difference of 0.18%), and Hawaiian (1.5%, a difference of 0.22%).
| Demographics | Rating | Rank | Doctorate Degree |
| Immigrants | Barbados | 0.4 /100 | #272 | Tragic 1.5% |
| Sioux | 0.4 /100 | #273 | Tragic 1.5% |
| Yaqui | 0.4 /100 | #274 | Tragic 1.5% |
| Aleuts | 0.4 /100 | #275 | Tragic 1.5% |
| Paiute | 0.4 /100 | #276 | Tragic 1.5% |
| Bahamians | 0.4 /100 | #277 | Tragic 1.5% |
| Hawaiians | 0.4 /100 | #278 | Tragic 1.5% |
| Marshallese | 0.4 /100 | #279 | Tragic 1.5% |
| Ecuadorians | 0.4 /100 | #280 | Tragic 1.5% |
| Tohono O'odham | 0.4 /100 | #281 | Tragic 1.5% |
| British West Indians | 0.3 /100 | #282 | Tragic 1.5% |
| Central Americans | 0.3 /100 | #283 | Tragic 1.5% |
| Jamaicans | 0.3 /100 | #284 | Tragic 1.5% |
| Malaysians | 0.3 /100 | #285 | Tragic 1.5% |
| Cherokee | 0.3 /100 | #286 | Tragic 1.5% |
Demographics Similar to West Indians by Doctorate Degree
In terms of doctorate degree, the demographic groups most similar to West Indians are Immigrants from Congo (1.6%, a difference of 0.10%), Immigrants from Panama (1.6%, a difference of 0.19%), Iroquois (1.6%, a difference of 0.31%), Cheyenne (1.6%, a difference of 0.38%), and Indonesian (1.6%, a difference of 0.50%).
| Demographics | Rating | Rank | Doctorate Degree |
| Guamanians/Chamorros | 3.3 /100 | #232 | Tragic 1.6% |
| Barbadians | 3.3 /100 | #233 | Tragic 1.6% |
| Hopi | 3.2 /100 | #234 | Tragic 1.6% |
| Cree | 3.0 /100 | #235 | Tragic 1.6% |
| Indonesians | 2.8 /100 | #236 | Tragic 1.6% |
| Iroquois | 2.7 /100 | #237 | Tragic 1.6% |
| Immigrants | Congo | 2.6 /100 | #238 | Tragic 1.6% |
| West Indians | 2.5 /100 | #239 | Tragic 1.6% |
| Immigrants | Panama | 2.4 /100 | #240 | Tragic 1.6% |
| Cheyenne | 2.3 /100 | #241 | Tragic 1.6% |
| Ottawa | 2.2 /100 | #242 | Tragic 1.6% |
| Native Hawaiians | 2.1 /100 | #243 | Tragic 1.6% |
| French American Indians | 2.0 /100 | #244 | Tragic 1.6% |
| Delaware | 1.9 /100 | #245 | Tragic 1.6% |
| Hmong | 1.8 /100 | #246 | Tragic 1.6% |