Welsh vs West Indian Doctorate Degree
COMPARE
Welsh
West Indian
Doctorate Degree
Doctorate Degree Comparison
Welsh
West Indians
1.9%
DOCTORATE DEGREE
69.7/ 100
METRIC RATING
160th/ 347
METRIC RANK
1.6%
DOCTORATE DEGREE
2.5/ 100
METRIC RATING
239th/ 347
METRIC RANK
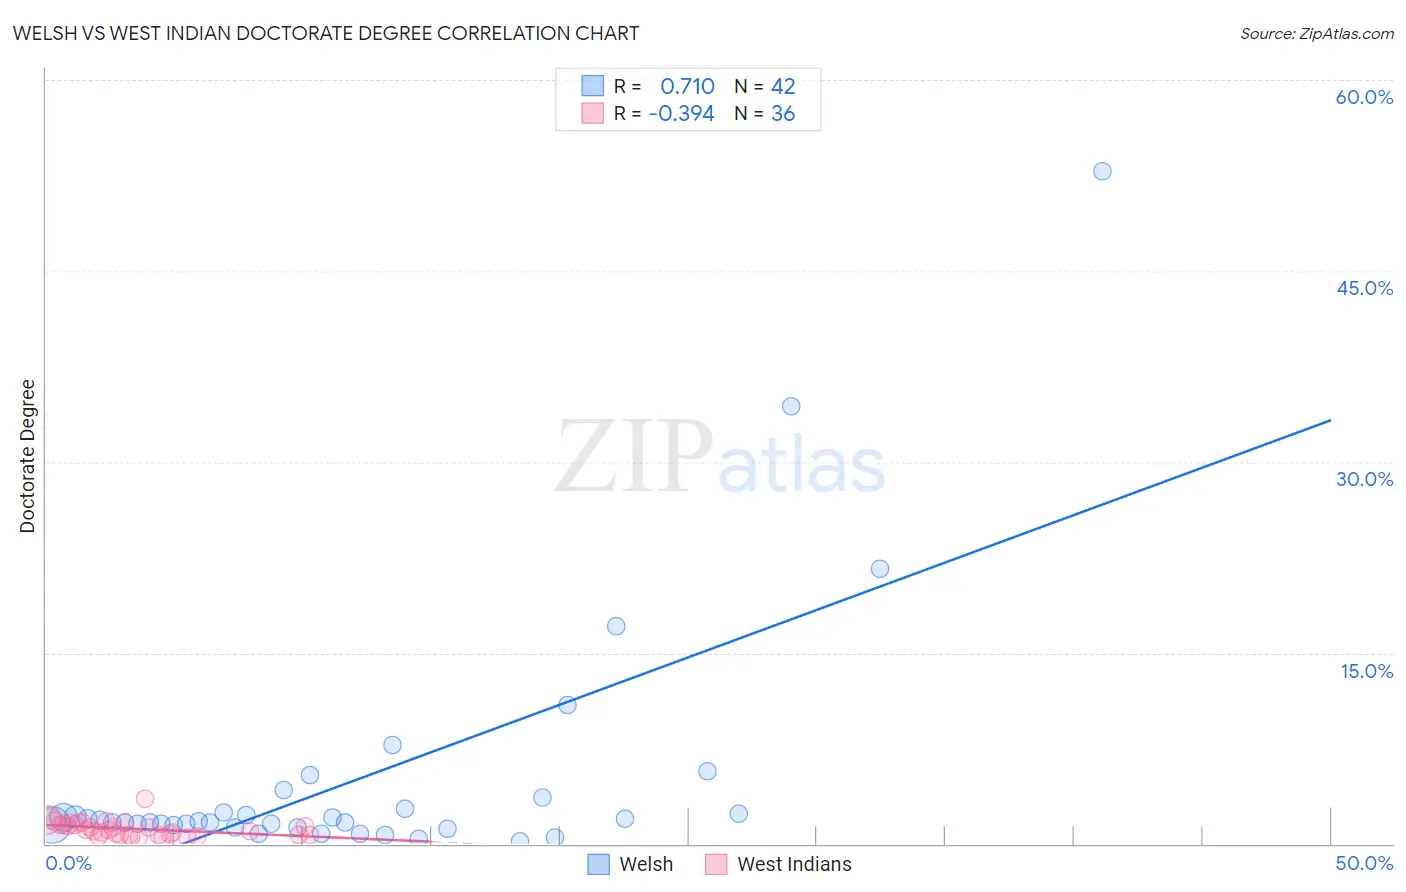
Welsh vs West Indian Doctorate Degree Correlation Chart
The statistical analysis conducted on geographies consisting of 512,102,106 people shows a strong positive correlation between the proportion of Welsh and percentage of population with at least doctorate degree education in the United States with a correlation coefficient (R) of 0.710 and weighted average of 1.9%. Similarly, the statistical analysis conducted on geographies consisting of 252,865,047 people shows a mild negative correlation between the proportion of West Indians and percentage of population with at least doctorate degree education in the United States with a correlation coefficient (R) of -0.394 and weighted average of 1.6%, a difference of 19.0%.
Doctorate Degree Correlation Summary
| Measurement | Welsh | West Indian |
| Minimum | 0.21% | 0.45% |
| Maximum | 52.8% | 3.5% |
| Range | 52.6% | 3.0% |
| Mean | 5.1% | 1.2% |
| Median | 1.7% | 1.1% |
| Interquartile 25% (IQ1) | 1.5% | 0.65% |
| Interquartile 75% (IQ3) | 2.7% | 1.6% |
| Interquartile Range (IQR) | 1.2% | 0.90% |
| Standard Deviation (Sample) | 9.9% | 0.60% |
| Standard Deviation (Population) | 9.8% | 0.59% |
Similar Demographics by Doctorate Degree
Demographics Similar to Welsh by Doctorate Degree
In terms of doctorate degree, the demographic groups most similar to Welsh are Slovene (1.9%, a difference of 0.090%), Immigrants from Middle Africa (1.9%, a difference of 0.15%), Hungarian (1.9%, a difference of 0.35%), Irish (1.9%, a difference of 0.36%), and Danish (1.9%, a difference of 0.38%).
| Demographics | Rating | Rank | Doctorate Degree |
| Immigrants | Oceania | 74.0 /100 | #153 | Good 1.9% |
| Immigrants | Albania | 72.8 /100 | #154 | Good 1.9% |
| Poles | 72.7 /100 | #155 | Good 1.9% |
| Slavs | 72.4 /100 | #156 | Good 1.9% |
| Danes | 71.9 /100 | #157 | Good 1.9% |
| Hungarians | 71.7 /100 | #158 | Good 1.9% |
| Slovenes | 70.2 /100 | #159 | Good 1.9% |
| Welsh | 69.7 /100 | #160 | Good 1.9% |
| Immigrants | Middle Africa | 68.8 /100 | #161 | Good 1.9% |
| Irish | 67.5 /100 | #162 | Good 1.9% |
| Czechs | 67.3 /100 | #163 | Good 1.9% |
| Celtics | 66.7 /100 | #164 | Good 1.9% |
| Scotch-Irish | 63.6 /100 | #165 | Good 1.9% |
| Spaniards | 63.5 /100 | #166 | Good 1.9% |
| Macedonians | 60.9 /100 | #167 | Good 1.9% |
Demographics Similar to West Indians by Doctorate Degree
In terms of doctorate degree, the demographic groups most similar to West Indians are Immigrants from Congo (1.6%, a difference of 0.10%), Immigrants from Panama (1.6%, a difference of 0.19%), Iroquois (1.6%, a difference of 0.31%), Cheyenne (1.6%, a difference of 0.38%), and Indonesian (1.6%, a difference of 0.50%).
| Demographics | Rating | Rank | Doctorate Degree |
| Guamanians/Chamorros | 3.3 /100 | #232 | Tragic 1.6% |
| Barbadians | 3.3 /100 | #233 | Tragic 1.6% |
| Hopi | 3.2 /100 | #234 | Tragic 1.6% |
| Cree | 3.0 /100 | #235 | Tragic 1.6% |
| Indonesians | 2.8 /100 | #236 | Tragic 1.6% |
| Iroquois | 2.7 /100 | #237 | Tragic 1.6% |
| Immigrants | Congo | 2.6 /100 | #238 | Tragic 1.6% |
| West Indians | 2.5 /100 | #239 | Tragic 1.6% |
| Immigrants | Panama | 2.4 /100 | #240 | Tragic 1.6% |
| Cheyenne | 2.3 /100 | #241 | Tragic 1.6% |
| Ottawa | 2.2 /100 | #242 | Tragic 1.6% |
| Native Hawaiians | 2.1 /100 | #243 | Tragic 1.6% |
| French American Indians | 2.0 /100 | #244 | Tragic 1.6% |
| Delaware | 1.9 /100 | #245 | Tragic 1.6% |
| Hmong | 1.8 /100 | #246 | Tragic 1.6% |