White/Caucasian vs Shoshone Doctorate Degree
COMPARE
White/Caucasian
Shoshone
Doctorate Degree
Doctorate Degree Comparison
Whites/Caucasians
Shoshone
1.8%
DOCTORATE DEGREE
22.8/ 100
METRIC RATING
200th/ 347
METRIC RANK
1.4%
DOCTORATE DEGREE
0.1/ 100
METRIC RATING
302nd/ 347
METRIC RANK
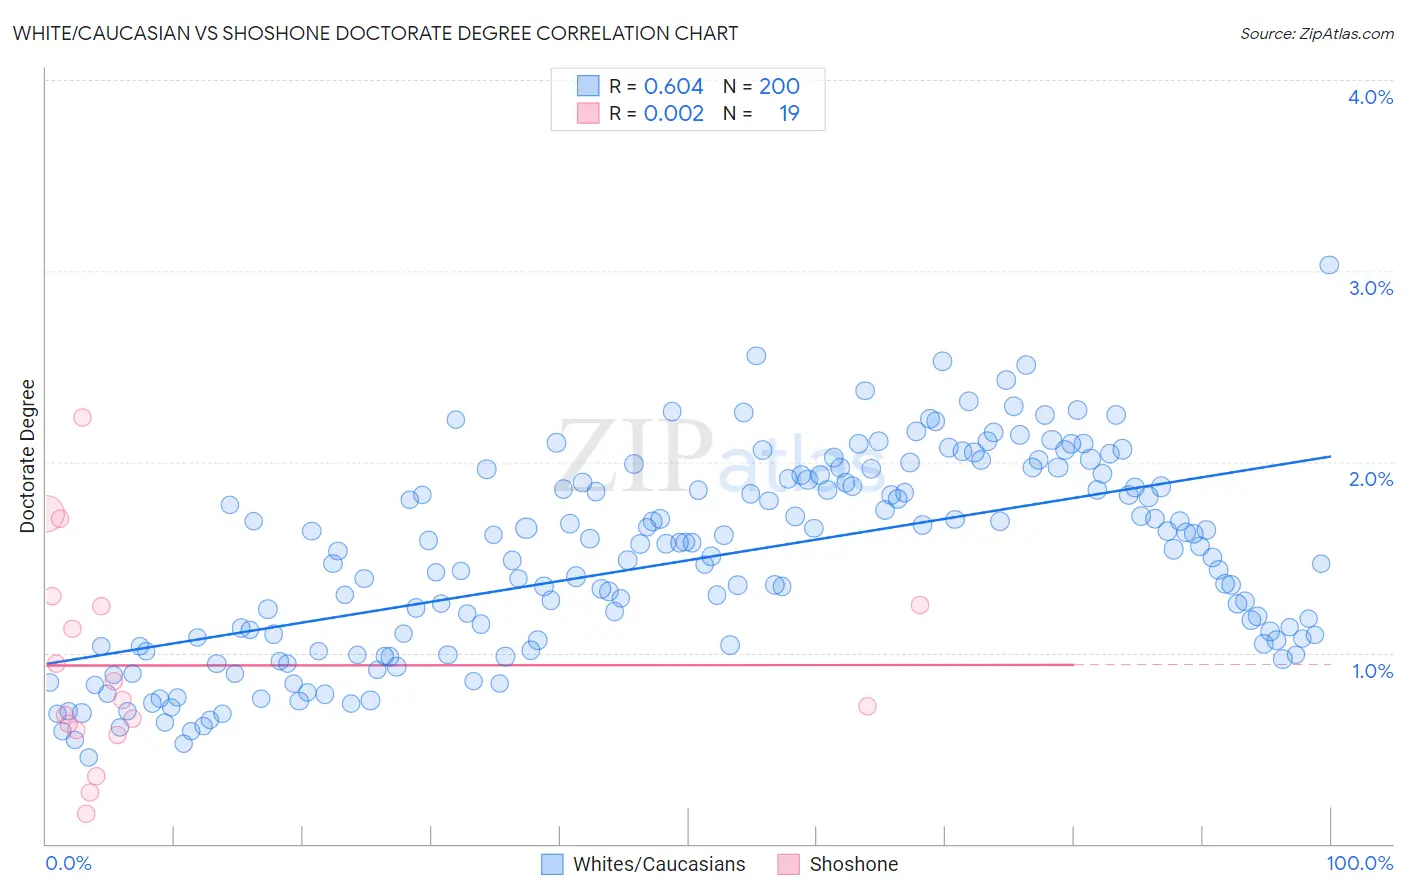
White/Caucasian vs Shoshone Doctorate Degree Correlation Chart
The statistical analysis conducted on geographies consisting of 553,713,140 people shows a significant positive correlation between the proportion of Whites/Caucasians and percentage of population with at least doctorate degree education in the United States with a correlation coefficient (R) of 0.604 and weighted average of 1.8%. Similarly, the statistical analysis conducted on geographies consisting of 66,163,741 people shows no correlation between the proportion of Shoshone and percentage of population with at least doctorate degree education in the United States with a correlation coefficient (R) of 0.002 and weighted average of 1.4%, a difference of 27.0%.
Doctorate Degree Correlation Summary
| Measurement | White/Caucasian | Shoshone |
| Minimum | 0.45% | 0.16% |
| Maximum | 3.0% | 2.2% |
| Range | 2.6% | 2.1% |
| Mean | 1.5% | 0.93% |
| Median | 1.5% | 0.75% |
| Interquartile 25% (IQ1) | 1.0% | 0.60% |
| Interquartile 75% (IQ3) | 1.9% | 1.3% |
| Interquartile Range (IQR) | 0.85% | 0.65% |
| Standard Deviation (Sample) | 0.52% | 0.54% |
| Standard Deviation (Population) | 0.52% | 0.52% |
Similar Demographics by Doctorate Degree
Demographics Similar to Whites/Caucasians by Doctorate Degree
In terms of doctorate degree, the demographic groups most similar to Whites/Caucasians are Immigrants from Nigeria (1.8%, a difference of 0.070%), Immigrants from South America (1.8%, a difference of 0.11%), Portuguese (1.8%, a difference of 0.29%), Immigrants from Vietnam (1.8%, a difference of 0.32%), and Somali (1.7%, a difference of 0.35%).
| Demographics | Rating | Rank | Doctorate Degree |
| German Russians | 27.1 /100 | #193 | Fair 1.8% |
| Uruguayans | 26.2 /100 | #194 | Fair 1.8% |
| Immigrants | Somalia | 25.4 /100 | #195 | Fair 1.8% |
| Sub-Saharan Africans | 25.1 /100 | #196 | Fair 1.8% |
| Chinese | 25.1 /100 | #197 | Fair 1.8% |
| Immigrants | Ghana | 24.6 /100 | #198 | Fair 1.8% |
| Immigrants | South America | 23.3 /100 | #199 | Fair 1.8% |
| Whites/Caucasians | 22.8 /100 | #200 | Fair 1.8% |
| Immigrants | Nigeria | 22.4 /100 | #201 | Fair 1.8% |
| Portuguese | 21.4 /100 | #202 | Fair 1.8% |
| Immigrants | Vietnam | 21.4 /100 | #203 | Fair 1.8% |
| Somalis | 21.2 /100 | #204 | Fair 1.7% |
| Venezuelans | 19.5 /100 | #205 | Poor 1.7% |
| Immigrants | Peru | 17.6 /100 | #206 | Poor 1.7% |
| Yugoslavians | 17.1 /100 | #207 | Poor 1.7% |
Demographics Similar to Shoshone by Doctorate Degree
In terms of doctorate degree, the demographic groups most similar to Shoshone are Immigrants from Dominica (1.4%, a difference of 0.030%), Mexican American Indian (1.4%, a difference of 0.090%), Pennsylvania German (1.4%, a difference of 0.22%), Guyanese (1.4%, a difference of 0.23%), and Honduran (1.4%, a difference of 0.33%).
| Demographics | Rating | Rank | Doctorate Degree |
| Guatemalans | 0.2 /100 | #295 | Tragic 1.4% |
| Immigrants | Ecuador | 0.2 /100 | #296 | Tragic 1.4% |
| Tsimshian | 0.2 /100 | #297 | Tragic 1.4% |
| Puerto Ricans | 0.1 /100 | #298 | Tragic 1.4% |
| Belizeans | 0.1 /100 | #299 | Tragic 1.4% |
| Immigrants | Guatemala | 0.1 /100 | #300 | Tragic 1.4% |
| Hondurans | 0.1 /100 | #301 | Tragic 1.4% |
| Shoshone | 0.1 /100 | #302 | Tragic 1.4% |
| Immigrants | Dominica | 0.1 /100 | #303 | Tragic 1.4% |
| Mexican American Indians | 0.1 /100 | #304 | Tragic 1.4% |
| Pennsylvania Germans | 0.1 /100 | #305 | Tragic 1.4% |
| Guyanese | 0.1 /100 | #306 | Tragic 1.4% |
| Cubans | 0.1 /100 | #307 | Tragic 1.4% |
| Immigrants | Laos | 0.1 /100 | #308 | Tragic 1.4% |
| Immigrants | Grenada | 0.1 /100 | #309 | Tragic 1.4% |