Palestinian vs West Indian Doctorate Degree
COMPARE
Palestinian
West Indian
Doctorate Degree
Doctorate Degree Comparison
Palestinians
West Indians
2.0%
DOCTORATE DEGREE
92.0/ 100
METRIC RATING
127th/ 347
METRIC RANK
1.6%
DOCTORATE DEGREE
2.5/ 100
METRIC RATING
239th/ 347
METRIC RANK
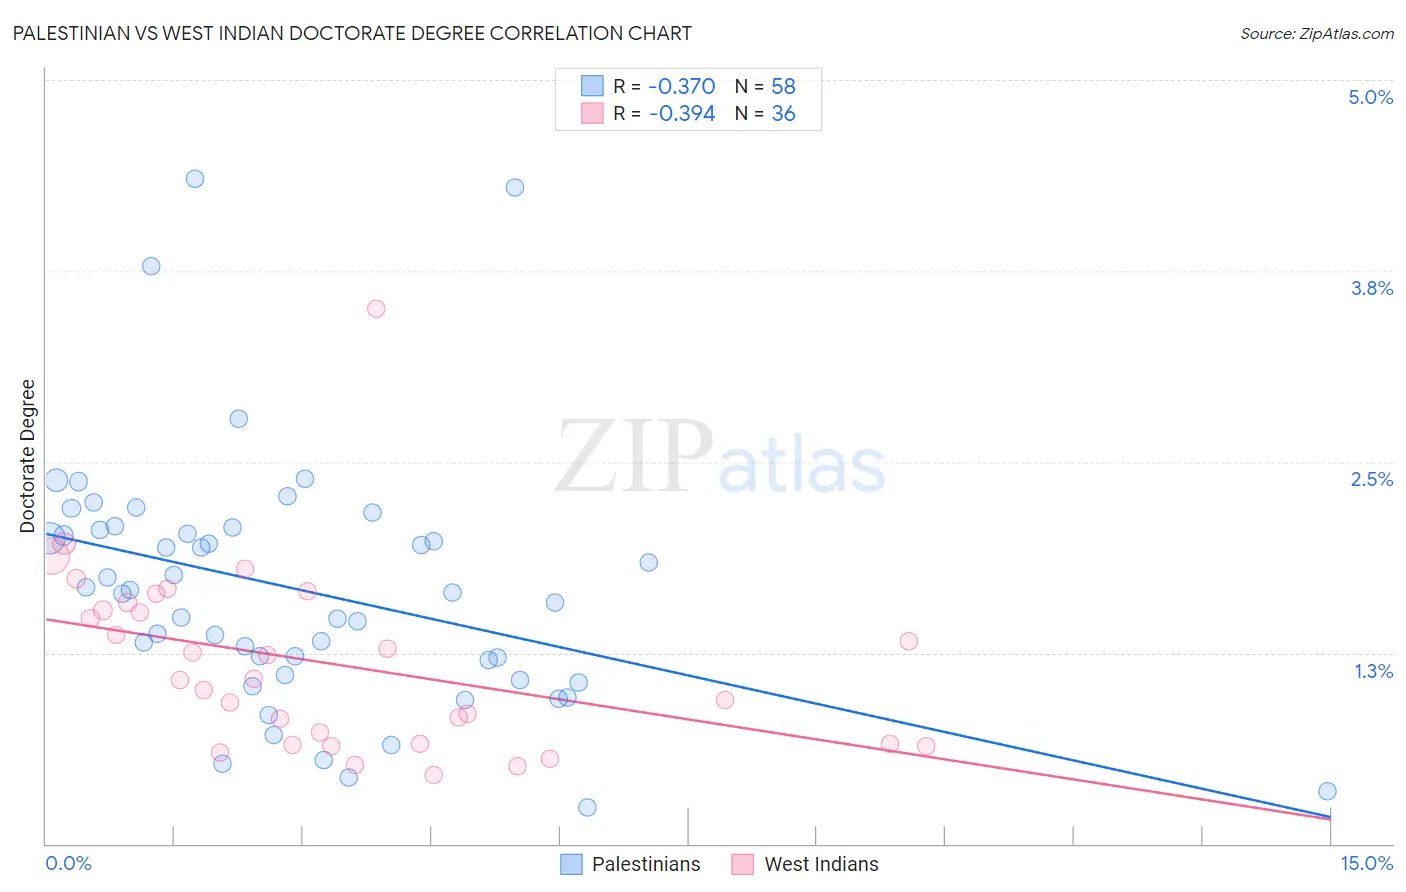
Palestinian vs West Indian Doctorate Degree Correlation Chart
The statistical analysis conducted on geographies consisting of 215,891,149 people shows a mild negative correlation between the proportion of Palestinians and percentage of population with at least doctorate degree education in the United States with a correlation coefficient (R) of -0.370 and weighted average of 2.0%. Similarly, the statistical analysis conducted on geographies consisting of 252,865,047 people shows a mild negative correlation between the proportion of West Indians and percentage of population with at least doctorate degree education in the United States with a correlation coefficient (R) of -0.394 and weighted average of 1.6%, a difference of 25.8%.
Doctorate Degree Correlation Summary
| Measurement | Palestinian | West Indian |
| Minimum | 0.24% | 0.45% |
| Maximum | 4.4% | 3.5% |
| Range | 4.1% | 3.0% |
| Mean | 1.7% | 1.2% |
| Median | 1.6% | 1.1% |
| Interquartile 25% (IQ1) | 1.1% | 0.65% |
| Interquartile 75% (IQ3) | 2.1% | 1.6% |
| Interquartile Range (IQR) | 0.95% | 0.90% |
| Standard Deviation (Sample) | 0.83% | 0.60% |
| Standard Deviation (Population) | 0.82% | 0.59% |
Similar Demographics by Doctorate Degree
Demographics Similar to Palestinians by Doctorate Degree
In terms of doctorate degree, the demographic groups most similar to Palestinians are Jordanian (2.0%, a difference of 0.040%), Immigrants from Zaire (2.0%, a difference of 0.42%), Moroccan (2.0%, a difference of 0.45%), Ute (2.0%, a difference of 0.56%), and Canadian (2.0%, a difference of 0.63%).
| Demographics | Rating | Rank | Doctorate Degree |
| Immigrants | Morocco | 95.5 /100 | #120 | Exceptional 2.0% |
| Immigrants | Jordan | 94.8 /100 | #121 | Exceptional 2.0% |
| Immigrants | Southern Europe | 94.7 /100 | #122 | Exceptional 2.0% |
| Croatians | 94.0 /100 | #123 | Exceptional 2.0% |
| Ute | 93.2 /100 | #124 | Exceptional 2.0% |
| Moroccans | 93.0 /100 | #125 | Exceptional 2.0% |
| Jordanians | 92.1 /100 | #126 | Exceptional 2.0% |
| Palestinians | 92.0 /100 | #127 | Exceptional 2.0% |
| Immigrants | Zaire | 91.1 /100 | #128 | Exceptional 2.0% |
| Canadians | 90.6 /100 | #129 | Exceptional 2.0% |
| Immigrants | Ukraine | 90.5 /100 | #130 | Exceptional 2.0% |
| Immigrants | Sierra Leone | 90.2 /100 | #131 | Exceptional 2.0% |
| Scottish | 89.4 /100 | #132 | Excellent 2.0% |
| Immigrants | Uzbekistan | 89.3 /100 | #133 | Excellent 2.0% |
| Immigrants | Cameroon | 88.9 /100 | #134 | Excellent 2.0% |
Demographics Similar to West Indians by Doctorate Degree
In terms of doctorate degree, the demographic groups most similar to West Indians are Immigrants from Congo (1.6%, a difference of 0.10%), Immigrants from Panama (1.6%, a difference of 0.19%), Iroquois (1.6%, a difference of 0.31%), Cheyenne (1.6%, a difference of 0.38%), and Indonesian (1.6%, a difference of 0.50%).
| Demographics | Rating | Rank | Doctorate Degree |
| Guamanians/Chamorros | 3.3 /100 | #232 | Tragic 1.6% |
| Barbadians | 3.3 /100 | #233 | Tragic 1.6% |
| Hopi | 3.2 /100 | #234 | Tragic 1.6% |
| Cree | 3.0 /100 | #235 | Tragic 1.6% |
| Indonesians | 2.8 /100 | #236 | Tragic 1.6% |
| Iroquois | 2.7 /100 | #237 | Tragic 1.6% |
| Immigrants | Congo | 2.6 /100 | #238 | Tragic 1.6% |
| West Indians | 2.5 /100 | #239 | Tragic 1.6% |
| Immigrants | Panama | 2.4 /100 | #240 | Tragic 1.6% |
| Cheyenne | 2.3 /100 | #241 | Tragic 1.6% |
| Ottawa | 2.2 /100 | #242 | Tragic 1.6% |
| Native Hawaiians | 2.1 /100 | #243 | Tragic 1.6% |
| French American Indians | 2.0 /100 | #244 | Tragic 1.6% |
| Delaware | 1.9 /100 | #245 | Tragic 1.6% |
| Hmong | 1.8 /100 | #246 | Tragic 1.6% |