White/Caucasian vs West Indian Single Father Households
COMPARE
White/Caucasian
West Indian
Single Father Households
Single Father Households Comparison
Whites/Caucasians
West Indians
2.4%
SINGLE FATHER HOUSEHOLDS
22.6/ 100
METRIC RATING
207th/ 347
METRIC RANK
2.2%
SINGLE FATHER HOUSEHOLDS
94.1/ 100
METRIC RATING
138th/ 347
METRIC RANK
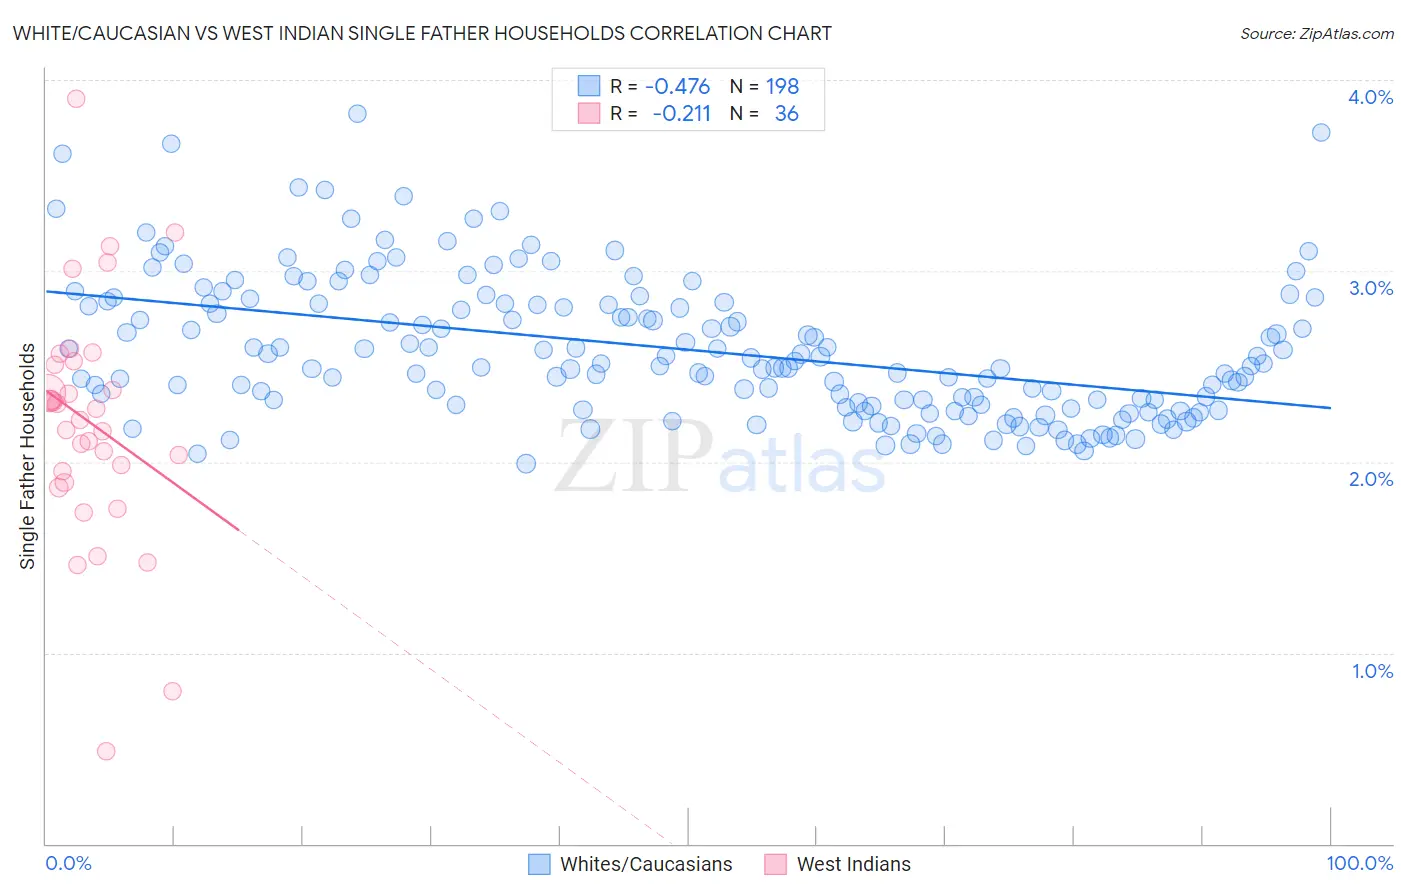
White/Caucasian vs West Indian Single Father Households Correlation Chart
The statistical analysis conducted on geographies consisting of 565,193,918 people shows a moderate negative correlation between the proportion of Whites/Caucasians and percentage of single father households in the United States with a correlation coefficient (R) of -0.476 and weighted average of 2.4%. Similarly, the statistical analysis conducted on geographies consisting of 252,761,215 people shows a weak negative correlation between the proportion of West Indians and percentage of single father households in the United States with a correlation coefficient (R) of -0.211 and weighted average of 2.2%, a difference of 7.7%.
Single Father Households Correlation Summary
| Measurement | White/Caucasian | West Indian |
| Minimum | 2.0% | 0.49% |
| Maximum | 3.8% | 3.9% |
| Range | 1.8% | 3.4% |
| Mean | 2.6% | 2.2% |
| Median | 2.5% | 2.3% |
| Interquartile 25% (IQ1) | 2.3% | 1.9% |
| Interquartile 75% (IQ3) | 2.8% | 2.5% |
| Interquartile Range (IQR) | 0.54% | 0.60% |
| Standard Deviation (Sample) | 0.37% | 0.64% |
| Standard Deviation (Population) | 0.37% | 0.63% |
Similar Demographics by Single Father Households
Demographics Similar to Whites/Caucasians by Single Father Households
In terms of single father households, the demographic groups most similar to Whites/Caucasians are Korean (2.4%, a difference of 0.15%), Immigrants from Afghanistan (2.4%, a difference of 0.16%), Ecuadorian (2.4%, a difference of 0.18%), French Canadian (2.4%, a difference of 0.21%), and Immigrants from Kenya (2.4%, a difference of 0.25%).
| Demographics | Rating | Rank | Single Father Households |
| Peruvians | 27.1 /100 | #200 | Fair 2.4% |
| Immigrants | Uganda | 26.0 /100 | #201 | Fair 2.4% |
| German Russians | 25.7 /100 | #202 | Fair 2.4% |
| French Canadians | 24.7 /100 | #203 | Fair 2.4% |
| Ecuadorians | 24.5 /100 | #204 | Fair 2.4% |
| Immigrants | Afghanistan | 24.2 /100 | #205 | Fair 2.4% |
| Koreans | 24.1 /100 | #206 | Fair 2.4% |
| Whites/Caucasians | 22.6 /100 | #207 | Fair 2.4% |
| Immigrants | Kenya | 20.3 /100 | #208 | Fair 2.4% |
| Immigrants | Peru | 19.3 /100 | #209 | Poor 2.4% |
| Immigrants | Costa Rica | 19.2 /100 | #210 | Poor 2.4% |
| Immigrants | Nigeria | 18.7 /100 | #211 | Poor 2.4% |
| Finns | 18.3 /100 | #212 | Poor 2.4% |
| Norwegians | 17.1 /100 | #213 | Poor 2.4% |
| Ethiopians | 16.6 /100 | #214 | Poor 2.4% |
Demographics Similar to West Indians by Single Father Households
In terms of single father households, the demographic groups most similar to West Indians are Austrian (2.2%, a difference of 0.030%), Chilean (2.2%, a difference of 0.14%), Syrian (2.2%, a difference of 0.26%), Zimbabwean (2.2%, a difference of 0.37%), and Brazilian (2.2%, a difference of 0.42%).
| Demographics | Rating | Rank | Single Father Households |
| Immigrants | Jordan | 96.6 /100 | #131 | Exceptional 2.2% |
| Poles | 96.5 /100 | #132 | Exceptional 2.2% |
| Taiwanese | 96.3 /100 | #133 | Exceptional 2.2% |
| Zimbabweans | 95.1 /100 | #134 | Exceptional 2.2% |
| Syrians | 94.8 /100 | #135 | Exceptional 2.2% |
| Chileans | 94.5 /100 | #136 | Exceptional 2.2% |
| Austrians | 94.2 /100 | #137 | Exceptional 2.2% |
| West Indians | 94.1 /100 | #138 | Exceptional 2.2% |
| Brazilians | 92.8 /100 | #139 | Exceptional 2.2% |
| British | 92.8 /100 | #140 | Exceptional 2.2% |
| Laotians | 92.5 /100 | #141 | Exceptional 2.2% |
| Luxembourgers | 92.3 /100 | #142 | Exceptional 2.2% |
| Immigrants | Nepal | 92.1 /100 | #143 | Exceptional 2.2% |
| Slovaks | 90.7 /100 | #144 | Exceptional 2.2% |
| Immigrants | Zimbabwe | 90.2 /100 | #145 | Exceptional 2.2% |