White/Caucasian vs Immigrants from Hong Kong Professional Degree
COMPARE
White/Caucasian
Immigrants from Hong Kong
Professional Degree
Professional Degree Comparison
Whites/Caucasians
Immigrants from Hong Kong
4.1%
PROFESSIONAL DEGREE
11.2/ 100
METRIC RATING
212th/ 347
METRIC RANK
6.4%
PROFESSIONAL DEGREE
100.0/ 100
METRIC RATING
21st/ 347
METRIC RANK
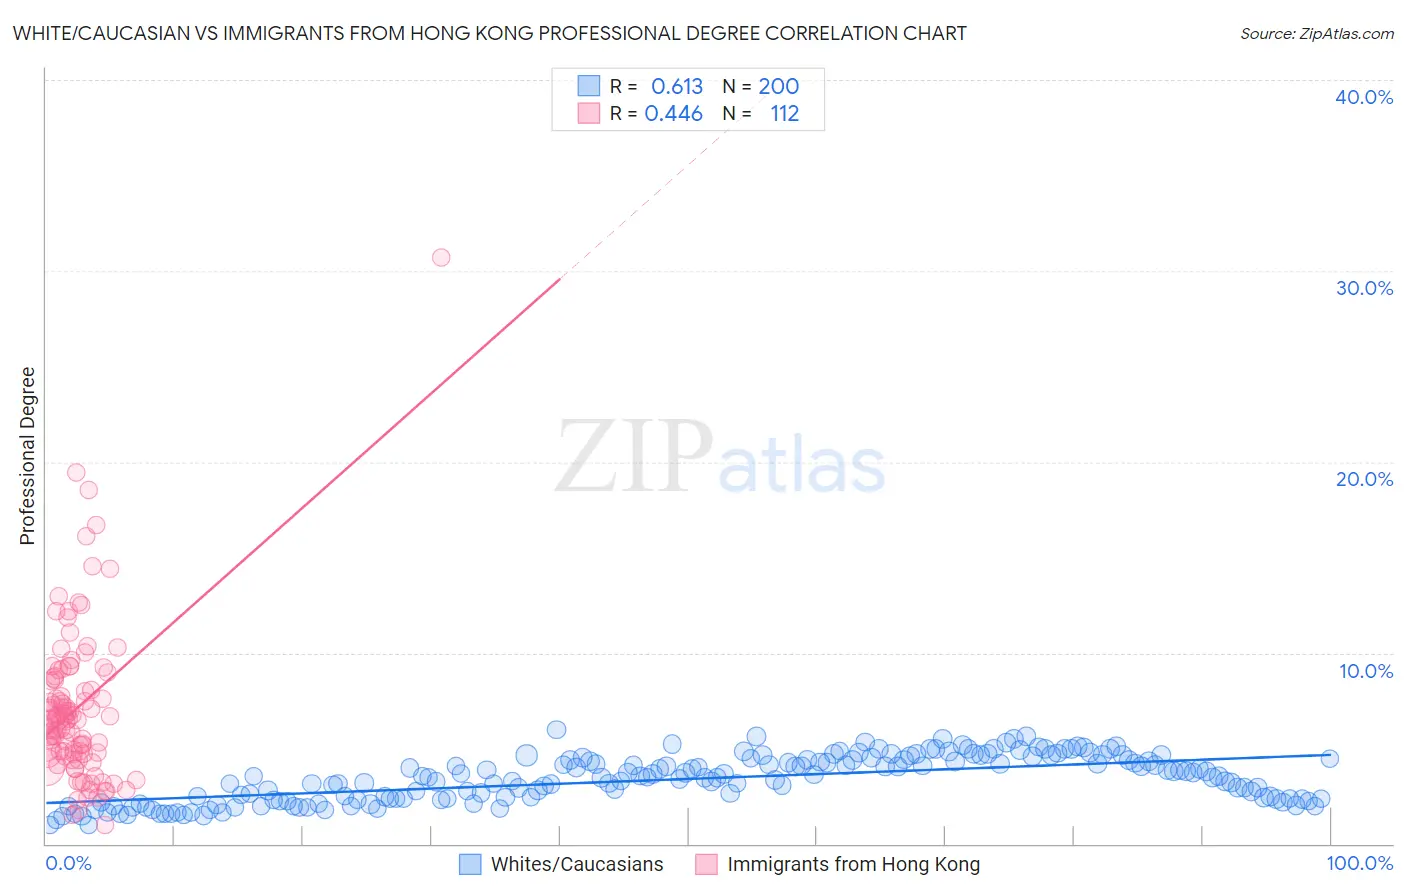
White/Caucasian vs Immigrants from Hong Kong Professional Degree Correlation Chart
The statistical analysis conducted on geographies consisting of 572,420,788 people shows a significant positive correlation between the proportion of Whites/Caucasians and percentage of population with at least professional degree education in the United States with a correlation coefficient (R) of 0.613 and weighted average of 4.1%. Similarly, the statistical analysis conducted on geographies consisting of 253,893,385 people shows a moderate positive correlation between the proportion of Immigrants from Hong Kong and percentage of population with at least professional degree education in the United States with a correlation coefficient (R) of 0.446 and weighted average of 6.4%, a difference of 57.3%.
Professional Degree Correlation Summary
| Measurement | White/Caucasian | Immigrants from Hong Kong |
| Minimum | 0.97% | 0.97% |
| Maximum | 6.0% | 30.7% |
| Range | 5.0% | 29.8% |
| Mean | 3.4% | 7.1% |
| Median | 3.5% | 6.5% |
| Interquartile 25% (IQ1) | 2.3% | 4.8% |
| Interquartile 75% (IQ3) | 4.4% | 8.6% |
| Interquartile Range (IQR) | 2.0% | 3.9% |
| Standard Deviation (Sample) | 1.2% | 4.1% |
| Standard Deviation (Population) | 1.2% | 4.1% |
Similar Demographics by Professional Degree
Demographics Similar to Whites/Caucasians by Professional Degree
In terms of professional degree, the demographic groups most similar to Whites/Caucasians are German (4.1%, a difference of 0.18%), Korean (4.1%, a difference of 0.18%), Immigrants from Nigeria (4.1%, a difference of 0.21%), Immigrants from Ghana (4.1%, a difference of 0.23%), and Portuguese (4.1%, a difference of 0.28%).
| Demographics | Rating | Rank | Professional Degree |
| Somalis | 14.8 /100 | #205 | Poor 4.1% |
| Yugoslavians | 13.4 /100 | #206 | Poor 4.1% |
| Sub-Saharan Africans | 12.8 /100 | #207 | Poor 4.1% |
| Immigrants | Somalia | 12.5 /100 | #208 | Poor 4.1% |
| Immigrants | Panama | 12.3 /100 | #209 | Poor 4.1% |
| Immigrants | Nigeria | 11.7 /100 | #210 | Poor 4.1% |
| Germans | 11.6 /100 | #211 | Poor 4.1% |
| Whites/Caucasians | 11.2 /100 | #212 | Poor 4.1% |
| Koreans | 10.7 /100 | #213 | Poor 4.1% |
| Immigrants | Ghana | 10.6 /100 | #214 | Poor 4.1% |
| Portuguese | 10.5 /100 | #215 | Poor 4.1% |
| West Indians | 9.8 /100 | #216 | Tragic 4.1% |
| Immigrants | Vietnam | 9.4 /100 | #217 | Tragic 4.0% |
| Dutch | 9.0 /100 | #218 | Tragic 4.0% |
| Immigrants | South Eastern Asia | 8.9 /100 | #219 | Tragic 4.0% |
Demographics Similar to Immigrants from Hong Kong by Professional Degree
In terms of professional degree, the demographic groups most similar to Immigrants from Hong Kong are Immigrants from Denmark (6.4%, a difference of 0.22%), Immigrants from Japan (6.4%, a difference of 0.73%), Russian (6.3%, a difference of 1.2%), Immigrants from Spain (6.3%, a difference of 1.3%), and Immigrants from Ireland (6.3%, a difference of 1.7%).
| Demographics | Rating | Rank | Professional Degree |
| Immigrants | France | 100.0 /100 | #14 | Exceptional 6.8% |
| Immigrants | China | 100.0 /100 | #15 | Exceptional 6.7% |
| Immigrants | Sweden | 100.0 /100 | #16 | Exceptional 6.7% |
| Immigrants | Eastern Asia | 100.0 /100 | #17 | Exceptional 6.6% |
| Soviet Union | 100.0 /100 | #18 | Exceptional 6.6% |
| Indians (Asian) | 100.0 /100 | #19 | Exceptional 6.5% |
| Immigrants | Denmark | 100.0 /100 | #20 | Exceptional 6.4% |
| Immigrants | Hong Kong | 100.0 /100 | #21 | Exceptional 6.4% |
| Immigrants | Japan | 100.0 /100 | #22 | Exceptional 6.4% |
| Russians | 100.0 /100 | #23 | Exceptional 6.3% |
| Immigrants | Spain | 100.0 /100 | #24 | Exceptional 6.3% |
| Immigrants | Ireland | 100.0 /100 | #25 | Exceptional 6.3% |
| Latvians | 100.0 /100 | #26 | Exceptional 6.2% |
| Immigrants | Northern Europe | 100.0 /100 | #27 | Exceptional 6.2% |
| Turks | 100.0 /100 | #28 | Exceptional 6.2% |