Hungarian vs Immigrants from Hong Kong Professional Degree
COMPARE
Hungarian
Immigrants from Hong Kong
Professional Degree
Professional Degree Comparison
Hungarians
Immigrants from Hong Kong
4.6%
PROFESSIONAL DEGREE
80.8/ 100
METRIC RATING
143rd/ 347
METRIC RANK
6.4%
PROFESSIONAL DEGREE
100.0/ 100
METRIC RATING
21st/ 347
METRIC RANK
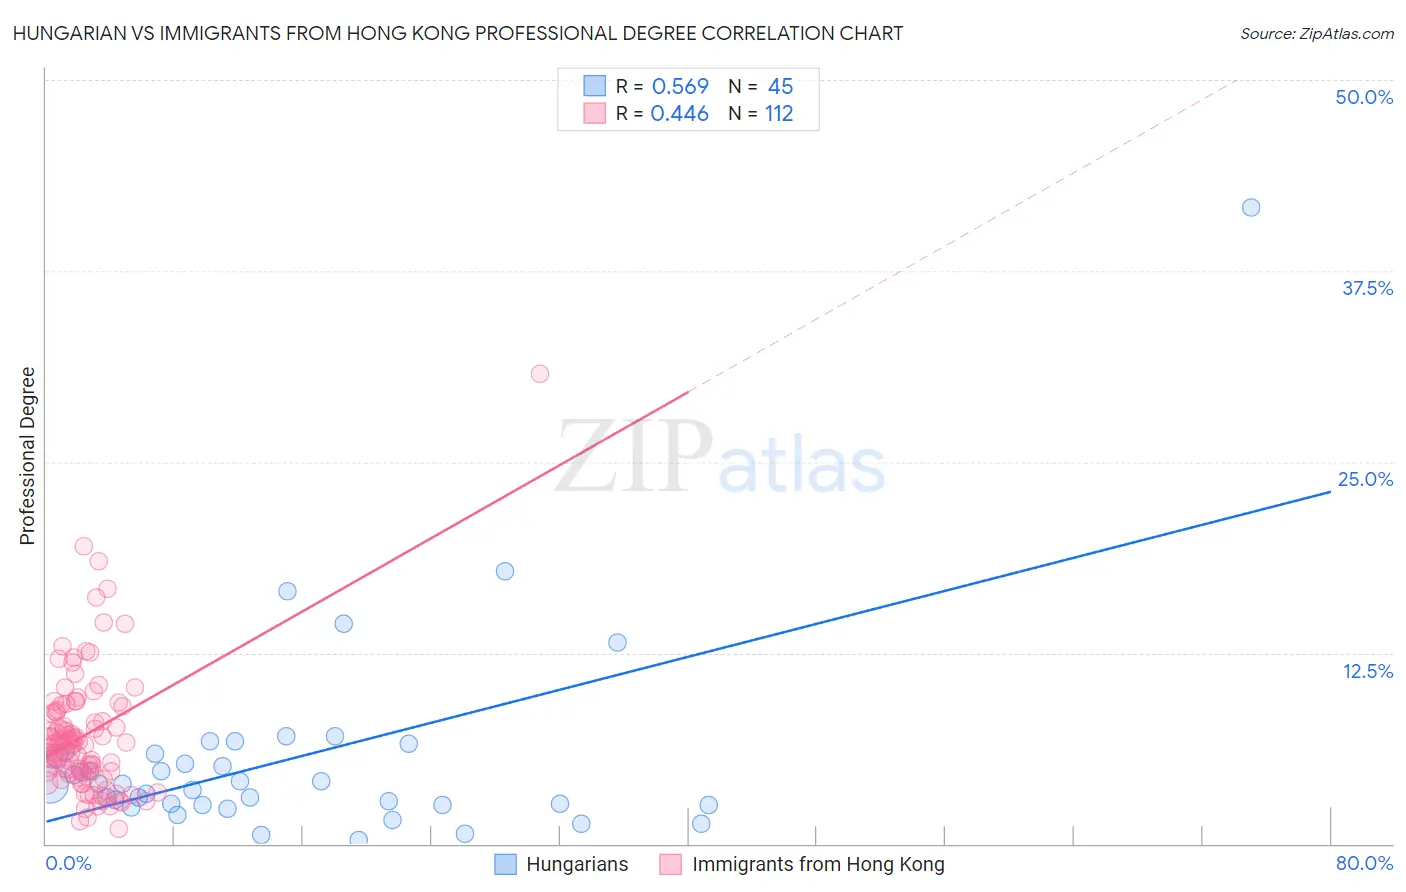
Hungarian vs Immigrants from Hong Kong Professional Degree Correlation Chart
The statistical analysis conducted on geographies consisting of 483,808,546 people shows a substantial positive correlation between the proportion of Hungarians and percentage of population with at least professional degree education in the United States with a correlation coefficient (R) of 0.569 and weighted average of 4.6%. Similarly, the statistical analysis conducted on geographies consisting of 253,893,385 people shows a moderate positive correlation between the proportion of Immigrants from Hong Kong and percentage of population with at least professional degree education in the United States with a correlation coefficient (R) of 0.446 and weighted average of 6.4%, a difference of 38.2%.
Professional Degree Correlation Summary
| Measurement | Hungarian | Immigrants from Hong Kong |
| Minimum | 0.21% | 0.97% |
| Maximum | 41.7% | 30.7% |
| Range | 41.5% | 29.8% |
| Mean | 5.6% | 7.1% |
| Median | 3.9% | 6.5% |
| Interquartile 25% (IQ1) | 2.5% | 4.8% |
| Interquartile 75% (IQ3) | 5.9% | 8.6% |
| Interquartile Range (IQR) | 3.4% | 3.9% |
| Standard Deviation (Sample) | 6.7% | 4.1% |
| Standard Deviation (Population) | 6.6% | 4.1% |
Similar Demographics by Professional Degree
Demographics Similar to Hungarians by Professional Degree
In terms of professional degree, the demographic groups most similar to Hungarians are Immigrants from South America (4.6%, a difference of 0.070%), Sudanese (4.6%, a difference of 0.11%), Uruguayan (4.6%, a difference of 0.13%), Basque (4.6%, a difference of 0.24%), and Luxembourger (4.6%, a difference of 0.44%).
| Demographics | Rating | Rank | Professional Degree |
| Immigrants | Jordan | 89.0 /100 | #136 | Excellent 4.7% |
| Jordanians | 88.9 /100 | #137 | Excellent 4.7% |
| Afghans | 88.8 /100 | #138 | Excellent 4.7% |
| South Americans | 85.6 /100 | #139 | Excellent 4.7% |
| Canadians | 84.4 /100 | #140 | Excellent 4.7% |
| Basques | 81.8 /100 | #141 | Excellent 4.6% |
| Sudanese | 81.3 /100 | #142 | Excellent 4.6% |
| Hungarians | 80.8 /100 | #143 | Excellent 4.6% |
| Immigrants | South America | 80.5 /100 | #144 | Excellent 4.6% |
| Uruguayans | 80.2 /100 | #145 | Excellent 4.6% |
| Luxembourgers | 78.7 /100 | #146 | Good 4.6% |
| Colombians | 77.7 /100 | #147 | Good 4.6% |
| Slovenes | 76.1 /100 | #148 | Good 4.6% |
| Senegalese | 75.3 /100 | #149 | Good 4.6% |
| Immigrants | Oceania | 73.4 /100 | #150 | Good 4.6% |
Demographics Similar to Immigrants from Hong Kong by Professional Degree
In terms of professional degree, the demographic groups most similar to Immigrants from Hong Kong are Immigrants from Denmark (6.4%, a difference of 0.22%), Immigrants from Japan (6.4%, a difference of 0.73%), Russian (6.3%, a difference of 1.2%), Immigrants from Spain (6.3%, a difference of 1.3%), and Immigrants from Ireland (6.3%, a difference of 1.7%).
| Demographics | Rating | Rank | Professional Degree |
| Immigrants | France | 100.0 /100 | #14 | Exceptional 6.8% |
| Immigrants | China | 100.0 /100 | #15 | Exceptional 6.7% |
| Immigrants | Sweden | 100.0 /100 | #16 | Exceptional 6.7% |
| Immigrants | Eastern Asia | 100.0 /100 | #17 | Exceptional 6.6% |
| Soviet Union | 100.0 /100 | #18 | Exceptional 6.6% |
| Indians (Asian) | 100.0 /100 | #19 | Exceptional 6.5% |
| Immigrants | Denmark | 100.0 /100 | #20 | Exceptional 6.4% |
| Immigrants | Hong Kong | 100.0 /100 | #21 | Exceptional 6.4% |
| Immigrants | Japan | 100.0 /100 | #22 | Exceptional 6.4% |
| Russians | 100.0 /100 | #23 | Exceptional 6.3% |
| Immigrants | Spain | 100.0 /100 | #24 | Exceptional 6.3% |
| Immigrants | Ireland | 100.0 /100 | #25 | Exceptional 6.3% |
| Latvians | 100.0 /100 | #26 | Exceptional 6.2% |
| Immigrants | Northern Europe | 100.0 /100 | #27 | Exceptional 6.2% |
| Turks | 100.0 /100 | #28 | Exceptional 6.2% |