Albanian vs Immigrants from Hong Kong Professional Degree
COMPARE
Albanian
Immigrants from Hong Kong
Professional Degree
Professional Degree Comparison
Albanians
Immigrants from Hong Kong
4.9%
PROFESSIONAL DEGREE
95.3/ 100
METRIC RATING
120th/ 347
METRIC RANK
6.4%
PROFESSIONAL DEGREE
100.0/ 100
METRIC RATING
21st/ 347
METRIC RANK
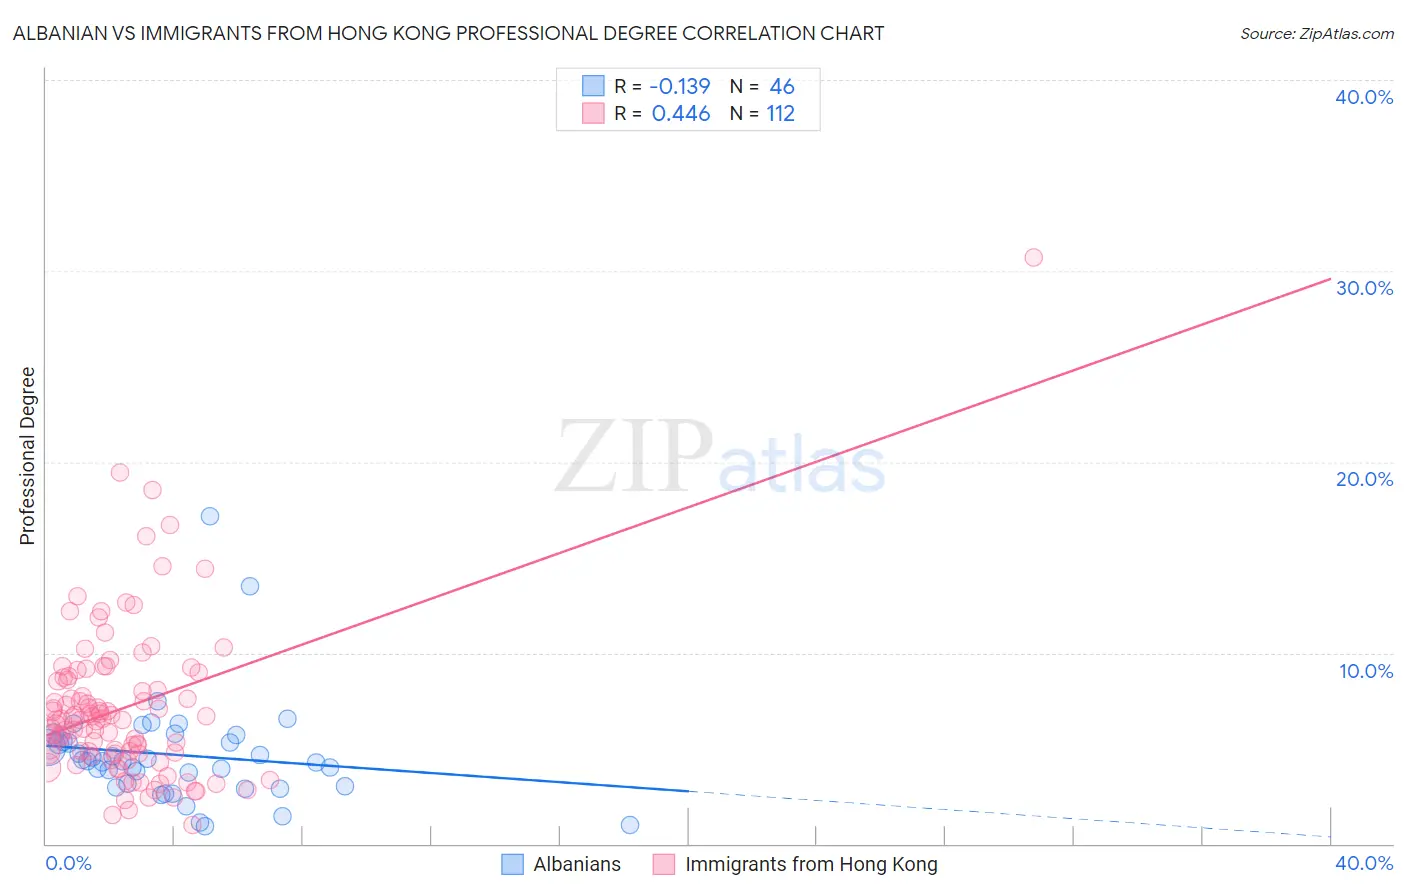
Albanian vs Immigrants from Hong Kong Professional Degree Correlation Chart
The statistical analysis conducted on geographies consisting of 193,107,529 people shows a poor negative correlation between the proportion of Albanians and percentage of population with at least professional degree education in the United States with a correlation coefficient (R) of -0.139 and weighted average of 4.9%. Similarly, the statistical analysis conducted on geographies consisting of 253,893,385 people shows a moderate positive correlation between the proportion of Immigrants from Hong Kong and percentage of population with at least professional degree education in the United States with a correlation coefficient (R) of 0.446 and weighted average of 6.4%, a difference of 31.1%.
Professional Degree Correlation Summary
| Measurement | Albanian | Immigrants from Hong Kong |
| Minimum | 0.91% | 0.97% |
| Maximum | 17.1% | 30.7% |
| Range | 16.2% | 29.8% |
| Mean | 4.7% | 7.1% |
| Median | 4.3% | 6.5% |
| Interquartile 25% (IQ1) | 3.0% | 4.8% |
| Interquartile 75% (IQ3) | 5.3% | 8.6% |
| Interquartile Range (IQR) | 2.3% | 3.9% |
| Standard Deviation (Sample) | 2.8% | 4.1% |
| Standard Deviation (Population) | 2.8% | 4.1% |
Similar Demographics by Professional Degree
Demographics Similar to Albanians by Professional Degree
In terms of professional degree, the demographic groups most similar to Albanians are Immigrants from Sudan (4.9%, a difference of 0.010%), Immigrants from Moldova (4.9%, a difference of 0.35%), Immigrants from Syria (4.9%, a difference of 0.55%), Croatian (4.9%, a difference of 0.55%), and Venezuelan (4.9%, a difference of 0.76%).
| Demographics | Rating | Rank | Professional Degree |
| Immigrants | Pakistan | 97.2 /100 | #113 | Exceptional 5.0% |
| Immigrants | Morocco | 96.8 /100 | #114 | Exceptional 5.0% |
| Moroccans | 96.8 /100 | #115 | Exceptional 5.0% |
| Venezuelans | 96.3 /100 | #116 | Exceptional 4.9% |
| Immigrants | Syria | 96.0 /100 | #117 | Exceptional 4.9% |
| Croatians | 96.0 /100 | #118 | Exceptional 4.9% |
| Immigrants | Sudan | 95.4 /100 | #119 | Exceptional 4.9% |
| Albanians | 95.3 /100 | #120 | Exceptional 4.9% |
| Immigrants | Moldova | 94.8 /100 | #121 | Exceptional 4.9% |
| Immigrants | Germany | 94.1 /100 | #122 | Exceptional 4.9% |
| Immigrants | Venezuela | 93.8 /100 | #123 | Exceptional 4.8% |
| Immigrants | Eritrea | 93.5 /100 | #124 | Exceptional 4.8% |
| Immigrants | Albania | 93.3 /100 | #125 | Exceptional 4.8% |
| Europeans | 93.2 /100 | #126 | Exceptional 4.8% |
| Serbians | 92.6 /100 | #127 | Exceptional 4.8% |
Demographics Similar to Immigrants from Hong Kong by Professional Degree
In terms of professional degree, the demographic groups most similar to Immigrants from Hong Kong are Immigrants from Denmark (6.4%, a difference of 0.22%), Immigrants from Japan (6.4%, a difference of 0.73%), Russian (6.3%, a difference of 1.2%), Immigrants from Spain (6.3%, a difference of 1.3%), and Immigrants from Ireland (6.3%, a difference of 1.7%).
| Demographics | Rating | Rank | Professional Degree |
| Immigrants | France | 100.0 /100 | #14 | Exceptional 6.8% |
| Immigrants | China | 100.0 /100 | #15 | Exceptional 6.7% |
| Immigrants | Sweden | 100.0 /100 | #16 | Exceptional 6.7% |
| Immigrants | Eastern Asia | 100.0 /100 | #17 | Exceptional 6.6% |
| Soviet Union | 100.0 /100 | #18 | Exceptional 6.6% |
| Indians (Asian) | 100.0 /100 | #19 | Exceptional 6.5% |
| Immigrants | Denmark | 100.0 /100 | #20 | Exceptional 6.4% |
| Immigrants | Hong Kong | 100.0 /100 | #21 | Exceptional 6.4% |
| Immigrants | Japan | 100.0 /100 | #22 | Exceptional 6.4% |
| Russians | 100.0 /100 | #23 | Exceptional 6.3% |
| Immigrants | Spain | 100.0 /100 | #24 | Exceptional 6.3% |
| Immigrants | Ireland | 100.0 /100 | #25 | Exceptional 6.3% |
| Latvians | 100.0 /100 | #26 | Exceptional 6.2% |
| Immigrants | Northern Europe | 100.0 /100 | #27 | Exceptional 6.2% |
| Turks | 100.0 /100 | #28 | Exceptional 6.2% |