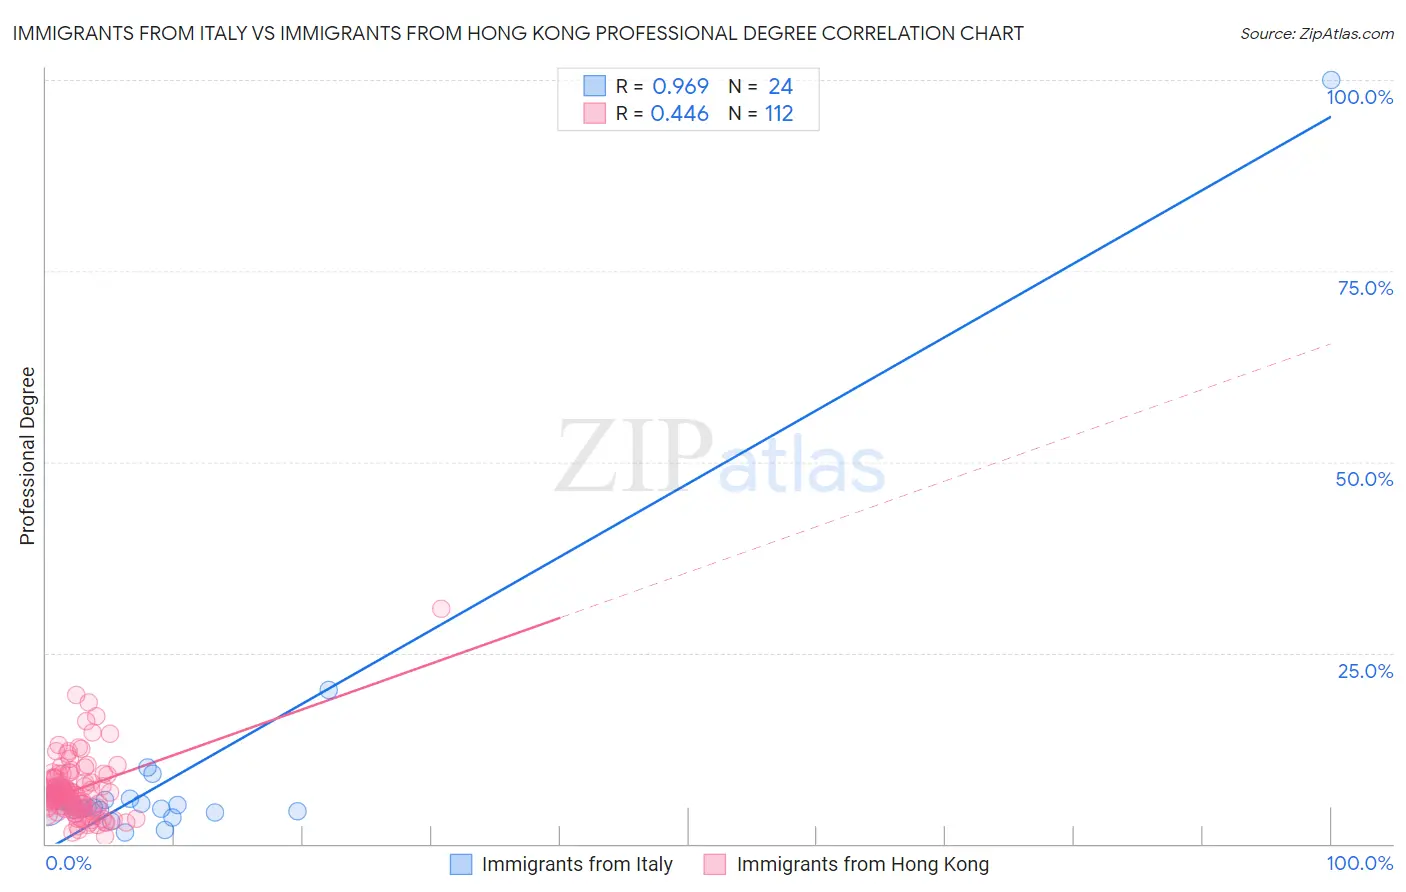
Immigrants from Italy vs Immigrants from Hong Kong Professional Degree
COMPARE
Immigrants from Italy
Immigrants from Hong Kong
Professional Degree
Professional Degree Comparison
Immigrants from Italy
Immigrants from Hong Kong
5.2%
PROFESSIONAL DEGREE
99.1/ 100
METRIC RATING
99th/ 347
METRIC RANK
6.4%
PROFESSIONAL DEGREE
100.0/ 100
METRIC RATING
21st/ 347
METRIC RANK
Immigrants from Italy vs Immigrants from Hong Kong Professional Degree Correlation Chart
The statistical analysis conducted on geographies consisting of 323,812,210 people shows a perfect positive correlation between the proportion of Immigrants from Italy and percentage of population with at least professional degree education in the United States with a correlation coefficient (R) of 0.969 and weighted average of 5.2%. Similarly, the statistical analysis conducted on geographies consisting of 253,893,385 people shows a moderate positive correlation between the proportion of Immigrants from Hong Kong and percentage of population with at least professional degree education in the United States with a correlation coefficient (R) of 0.446 and weighted average of 6.4%, a difference of 24.3%.
Professional Degree Correlation Summary
| Measurement | Immigrants from Italy | Immigrants from Hong Kong |
| Minimum | 1.5% | 0.97% |
| Maximum | 100.0% | 30.7% |
| Range | 98.5% | 29.8% |
| Mean | 9.6% | 7.1% |
| Median | 4.8% | 6.5% |
| Interquartile 25% (IQ1) | 4.4% | 4.8% |
| Interquartile 75% (IQ3) | 5.8% | 8.6% |
| Interquartile Range (IQR) | 1.4% | 3.9% |
| Standard Deviation (Sample) | 19.6% | 4.1% |
| Standard Deviation (Population) | 19.2% | 4.1% |
Similar Demographics by Professional Degree
Demographics Similar to Immigrants from Italy by Professional Degree
In terms of professional degree, the demographic groups most similar to Immigrants from Italy are Austrian (5.2%, a difference of 0.060%), Syrian (5.2%, a difference of 0.080%), Immigrants from Uzbekistan (5.2%, a difference of 0.43%), Ugandan (5.1%, a difference of 0.76%), and Zimbabwean (5.2%, a difference of 0.84%).
| Demographics | Rating | Rank | Professional Degree |
| Immigrants | Eastern Europe | 99.5 /100 | #92 | Exceptional 5.2% |
| Northern Europeans | 99.3 /100 | #93 | Exceptional 5.2% |
| Alsatians | 99.3 /100 | #94 | Exceptional 5.2% |
| Zimbabweans | 99.3 /100 | #95 | Exceptional 5.2% |
| Immigrants | Uzbekistan | 99.2 /100 | #96 | Exceptional 5.2% |
| Syrians | 99.1 /100 | #97 | Exceptional 5.2% |
| Austrians | 99.1 /100 | #98 | Exceptional 5.2% |
| Immigrants | Italy | 99.1 /100 | #99 | Exceptional 5.2% |
| Ugandans | 98.8 /100 | #100 | Exceptional 5.1% |
| Immigrants | Egypt | 98.5 /100 | #101 | Exceptional 5.1% |
| Ukrainians | 98.5 /100 | #102 | Exceptional 5.1% |
| Immigrants | Northern Africa | 98.4 /100 | #103 | Exceptional 5.1% |
| Arabs | 98.2 /100 | #104 | Exceptional 5.0% |
| Immigrants | Uganda | 98.2 /100 | #105 | Exceptional 5.0% |
| Immigrants | Ukraine | 98.2 /100 | #106 | Exceptional 5.0% |
Demographics Similar to Immigrants from Hong Kong by Professional Degree
In terms of professional degree, the demographic groups most similar to Immigrants from Hong Kong are Immigrants from Denmark (6.4%, a difference of 0.22%), Immigrants from Japan (6.4%, a difference of 0.73%), Russian (6.3%, a difference of 1.2%), Immigrants from Spain (6.3%, a difference of 1.3%), and Immigrants from Ireland (6.3%, a difference of 1.7%).
| Demographics | Rating | Rank | Professional Degree |
| Immigrants | France | 100.0 /100 | #14 | Exceptional 6.8% |
| Immigrants | China | 100.0 /100 | #15 | Exceptional 6.7% |
| Immigrants | Sweden | 100.0 /100 | #16 | Exceptional 6.7% |
| Immigrants | Eastern Asia | 100.0 /100 | #17 | Exceptional 6.6% |
| Soviet Union | 100.0 /100 | #18 | Exceptional 6.6% |
| Indians (Asian) | 100.0 /100 | #19 | Exceptional 6.5% |
| Immigrants | Denmark | 100.0 /100 | #20 | Exceptional 6.4% |
| Immigrants | Hong Kong | 100.0 /100 | #21 | Exceptional 6.4% |
| Immigrants | Japan | 100.0 /100 | #22 | Exceptional 6.4% |
| Russians | 100.0 /100 | #23 | Exceptional 6.3% |
| Immigrants | Spain | 100.0 /100 | #24 | Exceptional 6.3% |
| Immigrants | Ireland | 100.0 /100 | #25 | Exceptional 6.3% |
| Latvians | 100.0 /100 | #26 | Exceptional 6.2% |
| Immigrants | Northern Europe | 100.0 /100 | #27 | Exceptional 6.2% |
| Turks | 100.0 /100 | #28 | Exceptional 6.2% |