White/Caucasian vs Tsimshian Professional Degree
COMPARE
White/Caucasian
Tsimshian
Professional Degree
Professional Degree Comparison
Whites/Caucasians
Tsimshian
4.1%
PROFESSIONAL DEGREE
11.2/ 100
METRIC RATING
212th/ 347
METRIC RANK
3.2%
PROFESSIONAL DEGREE
0.0/ 100
METRIC RATING
321st/ 347
METRIC RANK
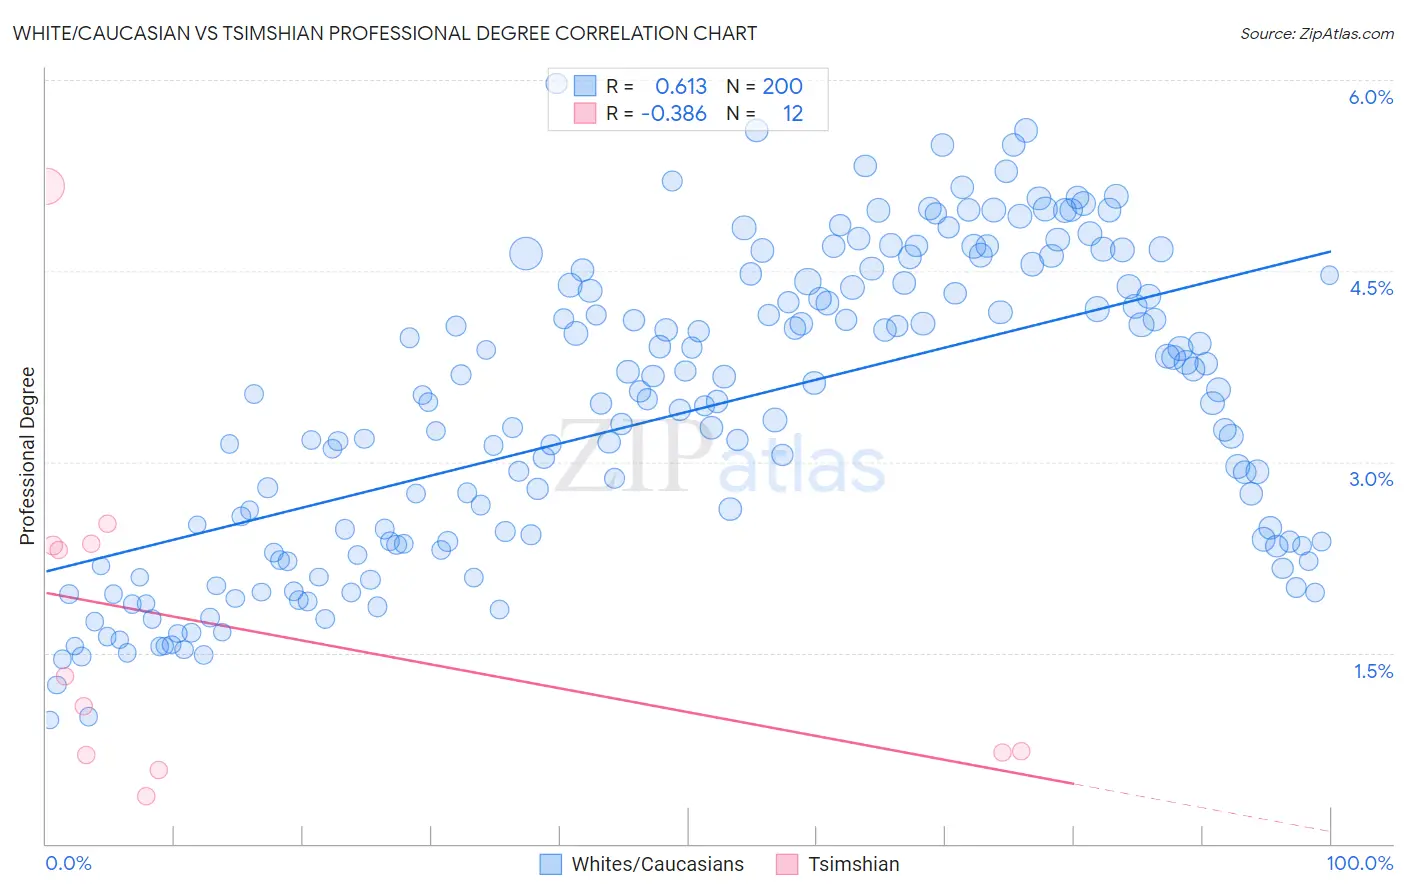
White/Caucasian vs Tsimshian Professional Degree Correlation Chart
The statistical analysis conducted on geographies consisting of 572,420,788 people shows a significant positive correlation between the proportion of Whites/Caucasians and percentage of population with at least professional degree education in the United States with a correlation coefficient (R) of 0.613 and weighted average of 4.1%. Similarly, the statistical analysis conducted on geographies consisting of 15,614,727 people shows a mild negative correlation between the proportion of Tsimshian and percentage of population with at least professional degree education in the United States with a correlation coefficient (R) of -0.386 and weighted average of 3.2%, a difference of 28.1%.
Professional Degree Correlation Summary
| Measurement | White/Caucasian | Tsimshian |
| Minimum | 0.97% | 0.38% |
| Maximum | 6.0% | 5.2% |
| Range | 5.0% | 4.8% |
| Mean | 3.4% | 1.7% |
| Median | 3.5% | 1.2% |
| Interquartile 25% (IQ1) | 2.3% | 0.71% |
| Interquartile 75% (IQ3) | 4.4% | 2.4% |
| Interquartile Range (IQR) | 2.0% | 1.6% |
| Standard Deviation (Sample) | 1.2% | 1.4% |
| Standard Deviation (Population) | 1.2% | 1.3% |
Similar Demographics by Professional Degree
Demographics Similar to Whites/Caucasians by Professional Degree
In terms of professional degree, the demographic groups most similar to Whites/Caucasians are German (4.1%, a difference of 0.18%), Korean (4.1%, a difference of 0.18%), Immigrants from Nigeria (4.1%, a difference of 0.21%), Immigrants from Ghana (4.1%, a difference of 0.23%), and Portuguese (4.1%, a difference of 0.28%).
| Demographics | Rating | Rank | Professional Degree |
| Somalis | 14.8 /100 | #205 | Poor 4.1% |
| Yugoslavians | 13.4 /100 | #206 | Poor 4.1% |
| Sub-Saharan Africans | 12.8 /100 | #207 | Poor 4.1% |
| Immigrants | Somalia | 12.5 /100 | #208 | Poor 4.1% |
| Immigrants | Panama | 12.3 /100 | #209 | Poor 4.1% |
| Immigrants | Nigeria | 11.7 /100 | #210 | Poor 4.1% |
| Germans | 11.6 /100 | #211 | Poor 4.1% |
| Whites/Caucasians | 11.2 /100 | #212 | Poor 4.1% |
| Koreans | 10.7 /100 | #213 | Poor 4.1% |
| Immigrants | Ghana | 10.6 /100 | #214 | Poor 4.1% |
| Portuguese | 10.5 /100 | #215 | Poor 4.1% |
| West Indians | 9.8 /100 | #216 | Tragic 4.1% |
| Immigrants | Vietnam | 9.4 /100 | #217 | Tragic 4.0% |
| Dutch | 9.0 /100 | #218 | Tragic 4.0% |
| Immigrants | South Eastern Asia | 8.9 /100 | #219 | Tragic 4.0% |
Demographics Similar to Tsimshian by Professional Degree
In terms of professional degree, the demographic groups most similar to Tsimshian are Seminole (3.2%, a difference of 0.36%), Hispanic or Latino (3.2%, a difference of 0.36%), Inupiat (3.2%, a difference of 0.44%), Crow (3.2%, a difference of 0.72%), and Yaqui (3.2%, a difference of 0.78%).
| Demographics | Rating | Rank | Professional Degree |
| Mexican American Indians | 0.1 /100 | #314 | Tragic 3.3% |
| Immigrants | Laos | 0.1 /100 | #315 | Tragic 3.2% |
| Puerto Ricans | 0.1 /100 | #316 | Tragic 3.2% |
| Nepalese | 0.1 /100 | #317 | Tragic 3.2% |
| Immigrants | Micronesia | 0.1 /100 | #318 | Tragic 3.2% |
| Choctaw | 0.1 /100 | #319 | Tragic 3.2% |
| Seminole | 0.1 /100 | #320 | Tragic 3.2% |
| Tsimshian | 0.0 /100 | #321 | Tragic 3.2% |
| Hispanics or Latinos | 0.0 /100 | #322 | Tragic 3.2% |
| Inupiat | 0.0 /100 | #323 | Tragic 3.2% |
| Crow | 0.0 /100 | #324 | Tragic 3.2% |
| Yaqui | 0.0 /100 | #325 | Tragic 3.2% |
| Menominee | 0.0 /100 | #326 | Tragic 3.1% |
| Dutch West Indians | 0.0 /100 | #327 | Tragic 3.1% |
| Creek | 0.0 /100 | #328 | Tragic 3.1% |