White/Caucasian vs Immigrants from Hong Kong Unemployment Among Seniors over 65 years
COMPARE
White/Caucasian
Immigrants from Hong Kong
Unemployment Among Seniors over 65 years
Unemployment Among Seniors over 65 years Comparison
Whites/Caucasians
Immigrants from Hong Kong
5.1%
UNEMPLOYMENT AMONG SENIORS OVER 65 YEARS
84.4/ 100
METRIC RATING
136th/ 347
METRIC RANK
5.1%
UNEMPLOYMENT AMONG SENIORS OVER 65 YEARS
74.0/ 100
METRIC RATING
154th/ 347
METRIC RANK
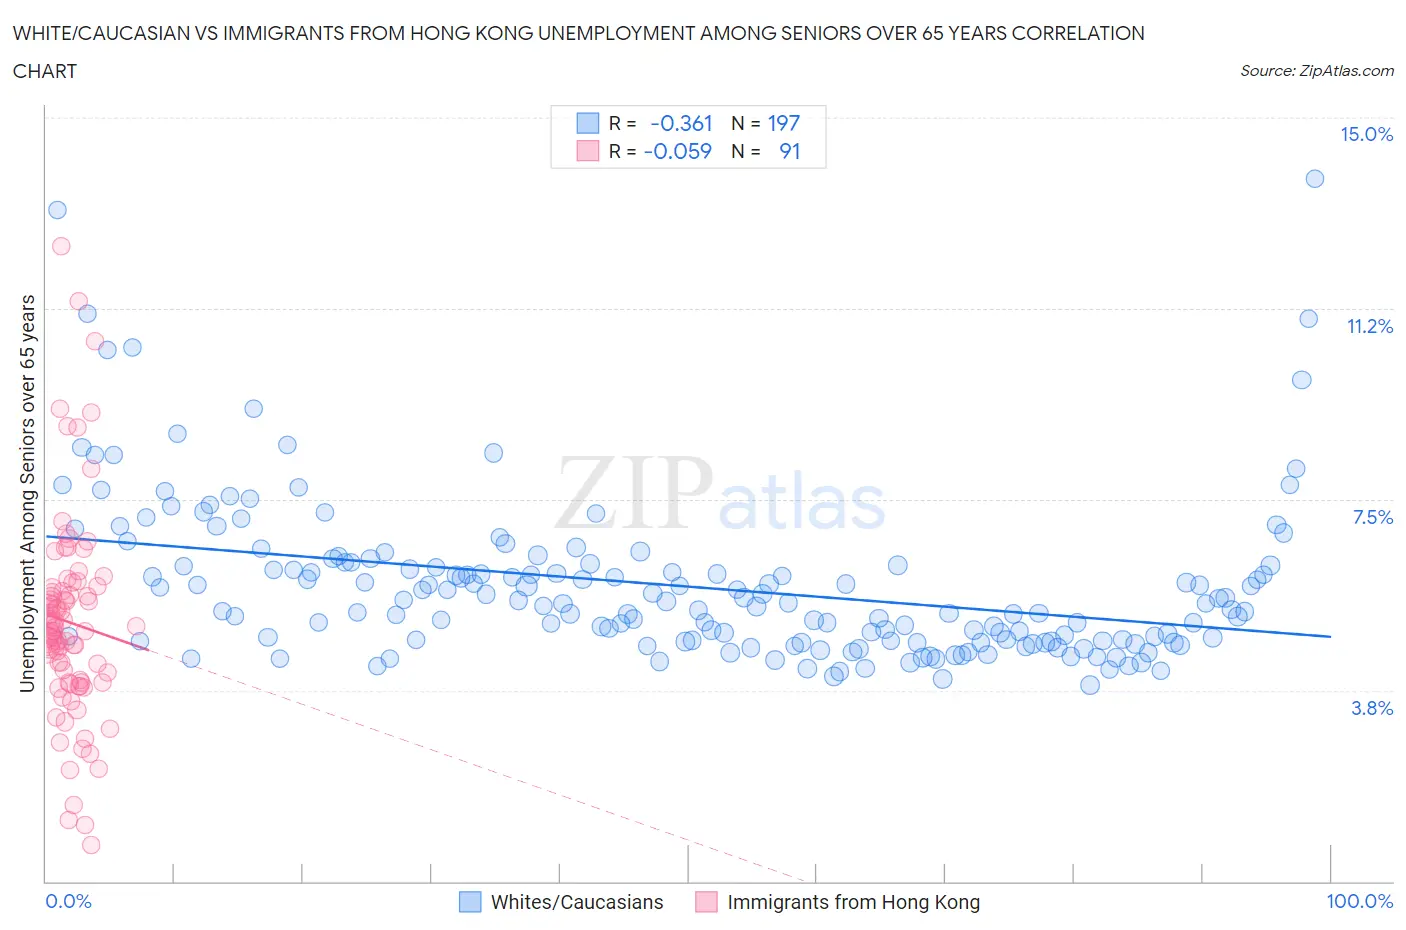
White/Caucasian vs Immigrants from Hong Kong Unemployment Among Seniors over 65 years Correlation Chart
The statistical analysis conducted on geographies consisting of 465,209,584 people shows a mild negative correlation between the proportion of Whites/Caucasians and unemployment rate amomg seniors over the age of 65 in the United States with a correlation coefficient (R) of -0.361 and weighted average of 5.1%. Similarly, the statistical analysis conducted on geographies consisting of 240,369,509 people shows a slight negative correlation between the proportion of Immigrants from Hong Kong and unemployment rate amomg seniors over the age of 65 in the United States with a correlation coefficient (R) of -0.059 and weighted average of 5.1%, a difference of 0.52%.
Unemployment Among Seniors over 65 years Correlation Summary
| Measurement | White/Caucasian | Immigrants from Hong Kong |
| Minimum | 3.9% | 0.70% |
| Maximum | 13.8% | 12.5% |
| Range | 9.9% | 11.8% |
| Mean | 5.8% | 5.1% |
| Median | 5.5% | 4.9% |
| Interquartile 25% (IQ1) | 4.7% | 3.9% |
| Interquartile 75% (IQ3) | 6.2% | 5.8% |
| Interquartile Range (IQR) | 1.5% | 1.9% |
| Standard Deviation (Sample) | 1.6% | 2.0% |
| Standard Deviation (Population) | 1.6% | 2.0% |
Demographics Similar to Whites/Caucasians and Immigrants from Hong Kong by Unemployment Among Seniors over 65 years
In terms of unemployment among seniors over 65 years, the demographic groups most similar to Whites/Caucasians are Ukrainian (5.1%, a difference of 0.0%), Arab (5.1%, a difference of 0.0%), New Zealander (5.1%, a difference of 0.070%), Immigrants from Panama (5.1%, a difference of 0.080%), and Immigrants from Chile (5.1%, a difference of 0.080%). Similarly, the demographic groups most similar to Immigrants from Hong Kong are Immigrants from Czechoslovakia (5.1%, a difference of 0.020%), Canadian (5.1%, a difference of 0.030%), Basque (5.1%, a difference of 0.050%), Pakistani (5.1%, a difference of 0.060%), and Immigrants from Asia (5.1%, a difference of 0.070%).
| Demographics | Rating | Rank | Unemployment Among Seniors over 65 years |
| Ukrainians | 84.4 /100 | #135 | Excellent 5.1% |
| Whites/Caucasians | 84.4 /100 | #136 | Excellent 5.1% |
| Arabs | 84.3 /100 | #137 | Excellent 5.1% |
| New Zealanders | 83.2 /100 | #138 | Excellent 5.1% |
| Immigrants | Panama | 83.0 /100 | #139 | Excellent 5.1% |
| Immigrants | Chile | 83.0 /100 | #140 | Excellent 5.1% |
| Cherokee | 81.6 /100 | #141 | Excellent 5.1% |
| Immigrants | Indonesia | 81.0 /100 | #142 | Excellent 5.1% |
| Senegalese | 80.4 /100 | #143 | Excellent 5.1% |
| Poles | 80.3 /100 | #144 | Excellent 5.1% |
| Spanish | 78.8 /100 | #145 | Good 5.1% |
| Immigrants | Russia | 78.5 /100 | #146 | Good 5.1% |
| Slovaks | 77.9 /100 | #147 | Good 5.1% |
| Greeks | 77.0 /100 | #148 | Good 5.1% |
| Immigrants | Afghanistan | 76.8 /100 | #149 | Good 5.1% |
| Immigrants | Asia | 75.6 /100 | #150 | Good 5.1% |
| Pakistanis | 75.5 /100 | #151 | Good 5.1% |
| Canadians | 74.7 /100 | #152 | Good 5.1% |
| Immigrants | Czechoslovakia | 74.5 /100 | #153 | Good 5.1% |
| Immigrants | Hong Kong | 74.0 /100 | #154 | Good 5.1% |
| Basques | 72.9 /100 | #155 | Good 5.1% |