Arapaho vs Immigrants from Hong Kong Professional Degree
COMPARE
Arapaho
Immigrants from Hong Kong
Professional Degree
Professional Degree Comparison
Arapaho
Immigrants from Hong Kong
2.9%
PROFESSIONAL DEGREE
0.0/ 100
METRIC RATING
337th/ 347
METRIC RANK
6.4%
PROFESSIONAL DEGREE
100.0/ 100
METRIC RATING
21st/ 347
METRIC RANK
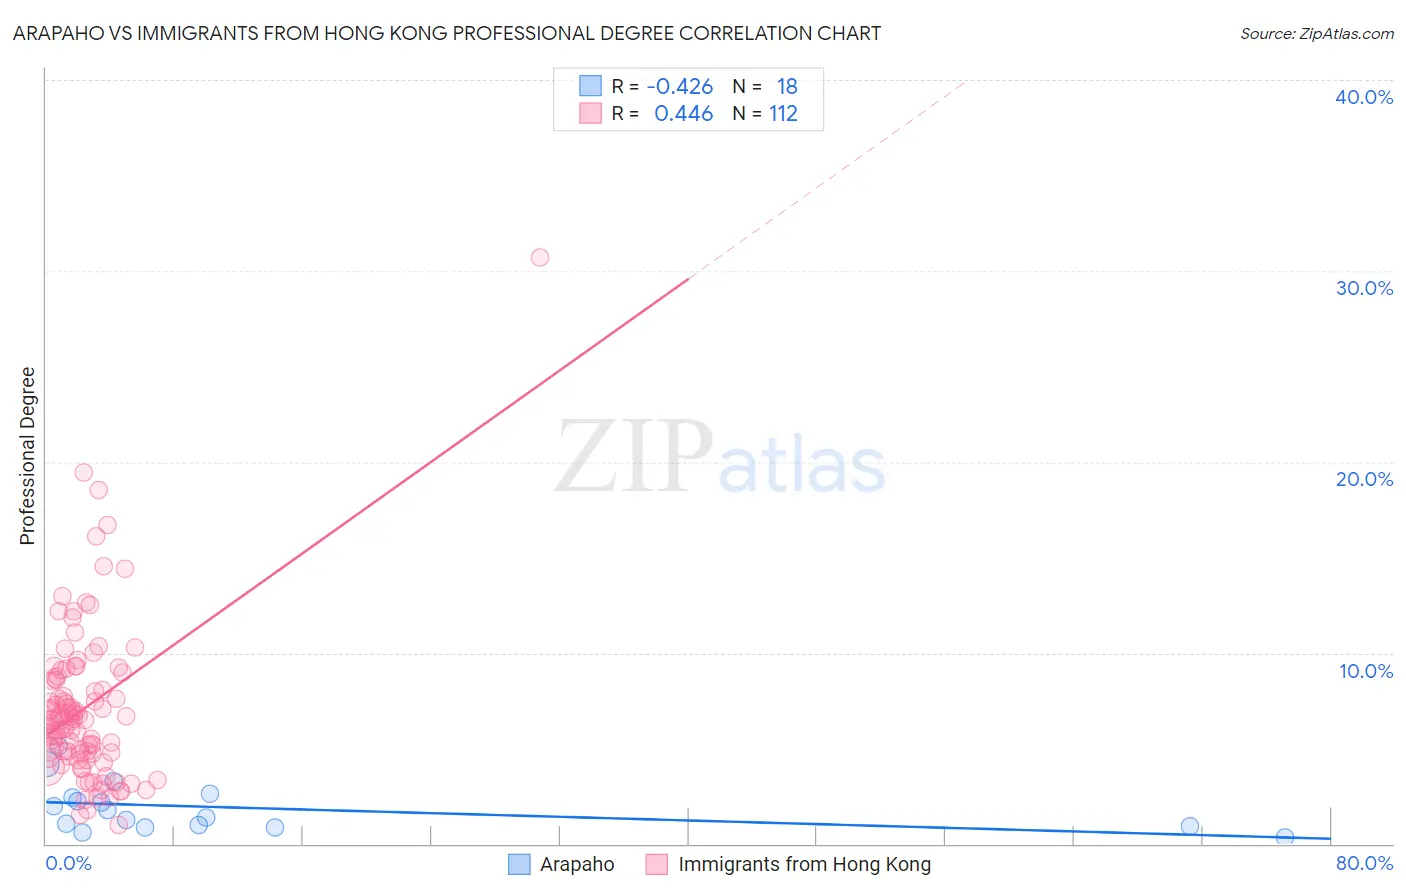
Arapaho vs Immigrants from Hong Kong Professional Degree Correlation Chart
The statistical analysis conducted on geographies consisting of 29,727,239 people shows a moderate negative correlation between the proportion of Arapaho and percentage of population with at least professional degree education in the United States with a correlation coefficient (R) of -0.426 and weighted average of 2.9%. Similarly, the statistical analysis conducted on geographies consisting of 253,893,385 people shows a moderate positive correlation between the proportion of Immigrants from Hong Kong and percentage of population with at least professional degree education in the United States with a correlation coefficient (R) of 0.446 and weighted average of 6.4%, a difference of 122.9%.
Professional Degree Correlation Summary
| Measurement | Arapaho | Immigrants from Hong Kong |
| Minimum | 0.33% | 0.97% |
| Maximum | 5.1% | 30.7% |
| Range | 4.8% | 29.8% |
| Mean | 1.9% | 7.1% |
| Median | 1.5% | 6.5% |
| Interquartile 25% (IQ1) | 0.91% | 4.8% |
| Interquartile 75% (IQ3) | 2.4% | 8.6% |
| Interquartile Range (IQR) | 1.5% | 3.9% |
| Standard Deviation (Sample) | 1.3% | 4.1% |
| Standard Deviation (Population) | 1.3% | 4.1% |
Similar Demographics by Professional Degree
Demographics Similar to Arapaho by Professional Degree
In terms of professional degree, the demographic groups most similar to Arapaho are Navajo (2.9%, a difference of 0.070%), Immigrants from Central America (2.9%, a difference of 0.19%), Yup'ik (2.9%, a difference of 0.24%), Tohono O'odham (2.8%, a difference of 1.0%), and Immigrants from the Azores (2.8%, a difference of 1.7%).
| Demographics | Rating | Rank | Professional Degree |
| Immigrants | Cabo Verde | 0.0 /100 | #330 | Tragic 3.1% |
| Kiowa | 0.0 /100 | #331 | Tragic 3.1% |
| Yakama | 0.0 /100 | #332 | Tragic 3.1% |
| Puget Sound Salish | 0.0 /100 | #333 | Tragic 3.1% |
| Pennsylvania Germans | 0.0 /100 | #334 | Tragic 3.0% |
| Natives/Alaskans | 0.0 /100 | #335 | Tragic 3.0% |
| Fijians | 0.0 /100 | #336 | Tragic 2.9% |
| Arapaho | 0.0 /100 | #337 | Tragic 2.9% |
| Navajo | 0.0 /100 | #338 | Tragic 2.9% |
| Immigrants | Central America | 0.0 /100 | #339 | Tragic 2.9% |
| Yup'ik | 0.0 /100 | #340 | Tragic 2.9% |
| Tohono O'odham | 0.0 /100 | #341 | Tragic 2.8% |
| Immigrants | Azores | 0.0 /100 | #342 | Tragic 2.8% |
| Mexicans | 0.0 /100 | #343 | Tragic 2.7% |
| Spanish American Indians | 0.0 /100 | #344 | Tragic 2.7% |
Demographics Similar to Immigrants from Hong Kong by Professional Degree
In terms of professional degree, the demographic groups most similar to Immigrants from Hong Kong are Immigrants from Denmark (6.4%, a difference of 0.22%), Immigrants from Japan (6.4%, a difference of 0.73%), Russian (6.3%, a difference of 1.2%), Immigrants from Spain (6.3%, a difference of 1.3%), and Immigrants from Ireland (6.3%, a difference of 1.7%).
| Demographics | Rating | Rank | Professional Degree |
| Immigrants | France | 100.0 /100 | #14 | Exceptional 6.8% |
| Immigrants | China | 100.0 /100 | #15 | Exceptional 6.7% |
| Immigrants | Sweden | 100.0 /100 | #16 | Exceptional 6.7% |
| Immigrants | Eastern Asia | 100.0 /100 | #17 | Exceptional 6.6% |
| Soviet Union | 100.0 /100 | #18 | Exceptional 6.6% |
| Indians (Asian) | 100.0 /100 | #19 | Exceptional 6.5% |
| Immigrants | Denmark | 100.0 /100 | #20 | Exceptional 6.4% |
| Immigrants | Hong Kong | 100.0 /100 | #21 | Exceptional 6.4% |
| Immigrants | Japan | 100.0 /100 | #22 | Exceptional 6.4% |
| Russians | 100.0 /100 | #23 | Exceptional 6.3% |
| Immigrants | Spain | 100.0 /100 | #24 | Exceptional 6.3% |
| Immigrants | Ireland | 100.0 /100 | #25 | Exceptional 6.3% |
| Latvians | 100.0 /100 | #26 | Exceptional 6.2% |
| Immigrants | Northern Europe | 100.0 /100 | #27 | Exceptional 6.2% |
| Turks | 100.0 /100 | #28 | Exceptional 6.2% |