White/Caucasian vs Immigrants from Hong Kong Female Poverty Among 18-24 Year Olds
COMPARE
White/Caucasian
Immigrants from Hong Kong
Female Poverty Among 18-24 Year Olds
Female Poverty Among 18-24 Year Olds Comparison
Whites/Caucasians
Immigrants from Hong Kong
20.8%
FEMALE POVERTY AMONG 18-24 YEAR OLDS
6.1/ 100
METRIC RATING
230th/ 347
METRIC RANK
17.5%
FEMALE POVERTY AMONG 18-24 YEAR OLDS
100.0/ 100
METRIC RATING
22nd/ 347
METRIC RANK
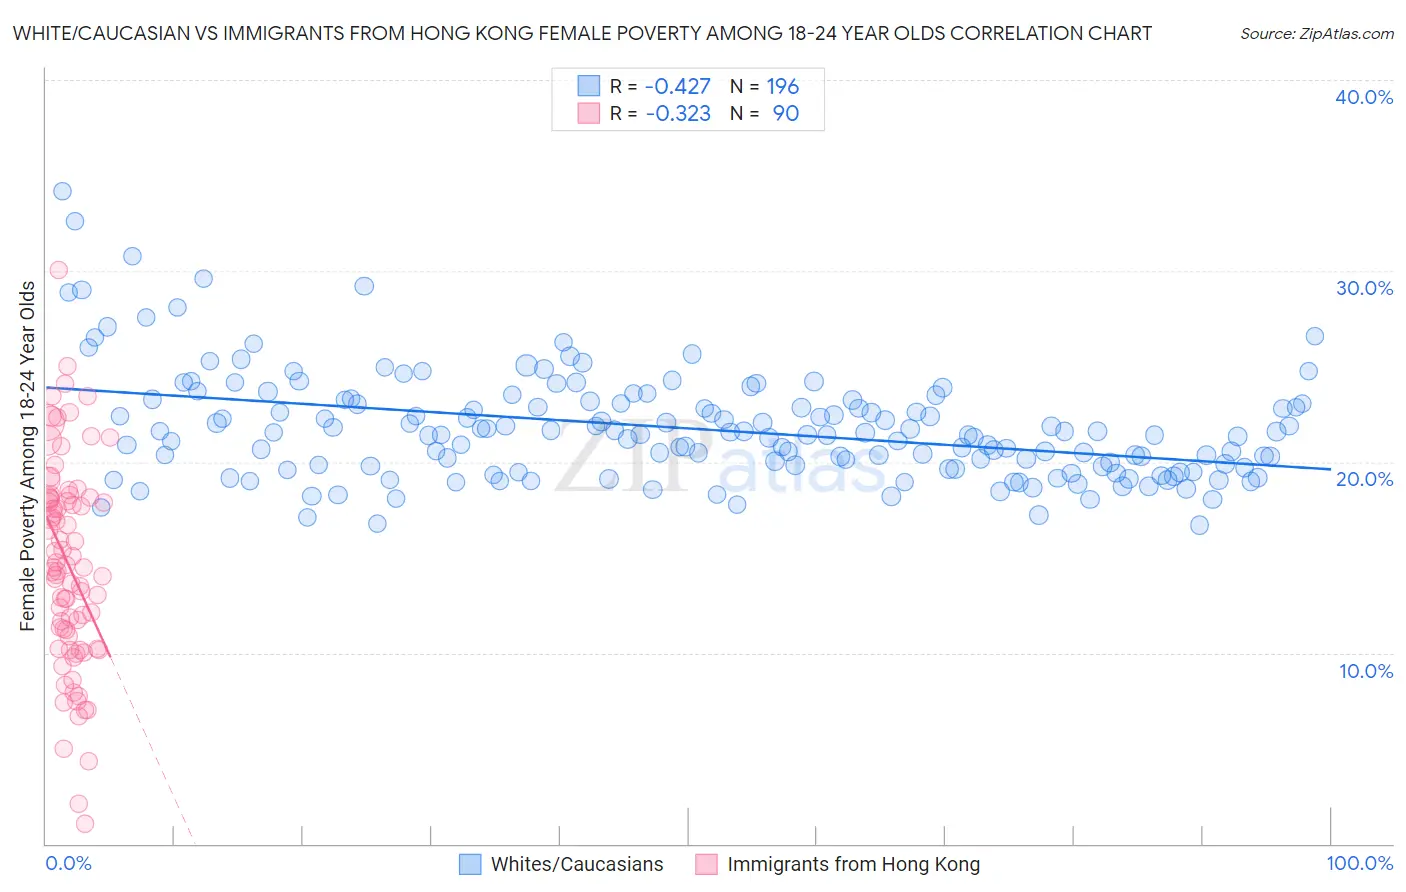
White/Caucasian vs Immigrants from Hong Kong Female Poverty Among 18-24 Year Olds Correlation Chart
The statistical analysis conducted on geographies consisting of 545,122,954 people shows a moderate negative correlation between the proportion of Whites/Caucasians and poverty level among females between the ages 18 and 24 in the United States with a correlation coefficient (R) of -0.427 and weighted average of 20.8%. Similarly, the statistical analysis conducted on geographies consisting of 249,802,041 people shows a mild negative correlation between the proportion of Immigrants from Hong Kong and poverty level among females between the ages 18 and 24 in the United States with a correlation coefficient (R) of -0.323 and weighted average of 17.5%, a difference of 19.0%.
Female Poverty Among 18-24 Year Olds Correlation Summary
| Measurement | White/Caucasian | Immigrants from Hong Kong |
| Minimum | 16.7% | 1.0% |
| Maximum | 34.2% | 30.1% |
| Range | 17.5% | 29.0% |
| Mean | 21.7% | 14.6% |
| Median | 21.4% | 14.5% |
| Interquartile 25% (IQ1) | 19.7% | 10.9% |
| Interquartile 75% (IQ3) | 23.1% | 18.1% |
| Interquartile Range (IQR) | 3.5% | 7.2% |
| Standard Deviation (Sample) | 2.9% | 5.4% |
| Standard Deviation (Population) | 2.8% | 5.3% |
Similar Demographics by Female Poverty Among 18-24 Year Olds
Demographics Similar to Whites/Caucasians by Female Poverty Among 18-24 Year Olds
In terms of female poverty among 18-24 year olds, the demographic groups most similar to Whites/Caucasians are Australian (20.8%, a difference of 0.0%), Immigrants from St. Vincent and the Grenadines (20.8%, a difference of 0.020%), Finnish (20.8%, a difference of 0.030%), Immigrants from Denmark (20.8%, a difference of 0.060%), and Ghanaian (20.8%, a difference of 0.070%).
| Demographics | Rating | Rank | Female Poverty Among 18-24 Year Olds |
| French | 7.9 /100 | #223 | Tragic 20.7% |
| Immigrants | Liberia | 7.6 /100 | #224 | Tragic 20.7% |
| Norwegians | 7.3 /100 | #225 | Tragic 20.7% |
| Estonians | 7.2 /100 | #226 | Tragic 20.7% |
| Immigrants | Sweden | 6.8 /100 | #227 | Tragic 20.7% |
| Ghanaians | 6.5 /100 | #228 | Tragic 20.8% |
| Australians | 6.1 /100 | #229 | Tragic 20.8% |
| Whites/Caucasians | 6.1 /100 | #230 | Tragic 20.8% |
| Immigrants | St. Vincent and the Grenadines | 6.0 /100 | #231 | Tragic 20.8% |
| Finns | 6.0 /100 | #232 | Tragic 20.8% |
| Immigrants | Denmark | 5.8 /100 | #233 | Tragic 20.8% |
| Welsh | 5.4 /100 | #234 | Tragic 20.8% |
| Immigrants | Uganda | 5.1 /100 | #235 | Tragic 20.8% |
| Okinawans | 4.9 /100 | #236 | Tragic 20.8% |
| Scottish | 4.5 /100 | #237 | Tragic 20.9% |
Demographics Similar to Immigrants from Hong Kong by Female Poverty Among 18-24 Year Olds
In terms of female poverty among 18-24 year olds, the demographic groups most similar to Immigrants from Hong Kong are Immigrants from Venezuela (17.4%, a difference of 0.10%), Bolivian (17.4%, a difference of 0.10%), Immigrants from Lithuania (17.4%, a difference of 0.23%), Immigrants from North Macedonia (17.6%, a difference of 0.56%), and Maltese (17.6%, a difference of 0.63%).
| Demographics | Rating | Rank | Female Poverty Among 18-24 Year Olds |
| Cubans | 100.0 /100 | #15 | Exceptional 17.2% |
| Peruvians | 100.0 /100 | #16 | Exceptional 17.2% |
| Immigrants | Taiwan | 100.0 /100 | #17 | Exceptional 17.3% |
| Immigrants | Colombia | 100.0 /100 | #18 | Exceptional 17.3% |
| Immigrants | Lithuania | 100.0 /100 | #19 | Exceptional 17.4% |
| Immigrants | Venezuela | 100.0 /100 | #20 | Exceptional 17.4% |
| Bolivians | 100.0 /100 | #21 | Exceptional 17.4% |
| Immigrants | Hong Kong | 100.0 /100 | #22 | Exceptional 17.5% |
| Immigrants | North Macedonia | 100.0 /100 | #23 | Exceptional 17.6% |
| Maltese | 100.0 /100 | #24 | Exceptional 17.6% |
| Immigrants | South Central Asia | 100.0 /100 | #25 | Exceptional 17.6% |
| Immigrants | Fiji | 100.0 /100 | #26 | Exceptional 17.7% |
| Colombians | 100.0 /100 | #27 | Exceptional 17.7% |
| Venezuelans | 100.0 /100 | #28 | Exceptional 17.7% |
| Portuguese | 100.0 /100 | #29 | Exceptional 17.8% |