White/Caucasian vs Immigrants from Cambodia 9th Grade
COMPARE
White/Caucasian
Immigrants from Cambodia
9th Grade
9th Grade Comparison
Whites/Caucasians
Immigrants from Cambodia
95.8%
9TH GRADE
99.4/ 100
METRIC RATING
77th/ 347
METRIC RANK
92.4%
9TH GRADE
0.0/ 100
METRIC RATING
310th/ 347
METRIC RANK
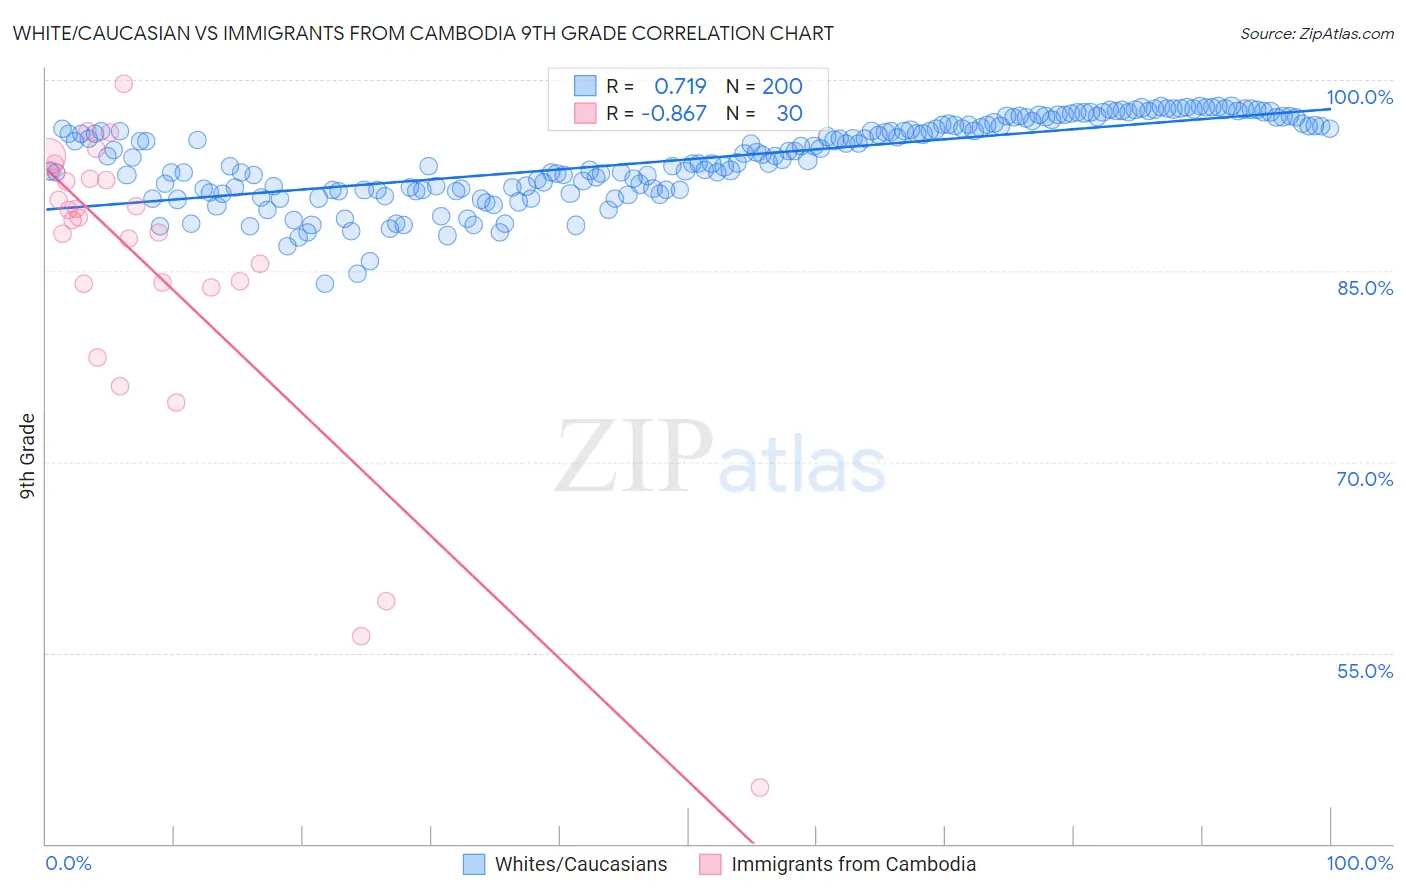
White/Caucasian vs Immigrants from Cambodia 9th Grade Correlation Chart
The statistical analysis conducted on geographies consisting of 585,245,517 people shows a strong positive correlation between the proportion of Whites/Caucasians and percentage of population with at least 9th grade education in the United States with a correlation coefficient (R) of 0.719 and weighted average of 95.8%. Similarly, the statistical analysis conducted on geographies consisting of 205,153,442 people shows a very strong negative correlation between the proportion of Immigrants from Cambodia and percentage of population with at least 9th grade education in the United States with a correlation coefficient (R) of -0.867 and weighted average of 92.4%, a difference of 3.7%.
9th Grade Correlation Summary
| Measurement | White/Caucasian | Immigrants from Cambodia |
| Minimum | 84.0% | 44.4% |
| Maximum | 98.0% | 99.7% |
| Range | 14.0% | 55.2% |
| Mean | 93.8% | 85.2% |
| Median | 94.1% | 89.1% |
| Interquartile 25% (IQ1) | 91.4% | 84.0% |
| Interquartile 75% (IQ3) | 96.5% | 92.2% |
| Interquartile Range (IQR) | 5.1% | 8.2% |
| Standard Deviation (Sample) | 3.2% | 12.4% |
| Standard Deviation (Population) | 3.2% | 12.2% |
Similar Demographics by 9th Grade
Demographics Similar to Whites/Caucasians by 9th Grade
In terms of 9th grade, the demographic groups most similar to Whites/Caucasians are Immigrants from South Africa (95.8%, a difference of 0.0%), Inupiat (95.8%, a difference of 0.010%), Immigrants from Sweden (95.8%, a difference of 0.010%), Thai (95.8%, a difference of 0.020%), and Immigrants from Belgium (95.8%, a difference of 0.030%).
| Demographics | Rating | Rank | 9th Grade |
| Immigrants | Australia | 99.5 /100 | #70 | Exceptional 95.8% |
| Immigrants | Belgium | 99.5 /100 | #71 | Exceptional 95.8% |
| Turks | 99.5 /100 | #72 | Exceptional 95.8% |
| Immigrants | Singapore | 99.5 /100 | #73 | Exceptional 95.8% |
| Thais | 99.5 /100 | #74 | Exceptional 95.8% |
| Inupiat | 99.5 /100 | #75 | Exceptional 95.8% |
| Immigrants | Sweden | 99.5 /100 | #76 | Exceptional 95.8% |
| Whites/Caucasians | 99.4 /100 | #77 | Exceptional 95.8% |
| Immigrants | South Africa | 99.4 /100 | #78 | Exceptional 95.8% |
| Romanians | 99.3 /100 | #79 | Exceptional 95.7% |
| Bhutanese | 99.3 /100 | #80 | Exceptional 95.7% |
| Arapaho | 99.3 /100 | #81 | Exceptional 95.7% |
| Puget Sound Salish | 99.2 /100 | #82 | Exceptional 95.7% |
| Swiss | 99.2 /100 | #83 | Exceptional 95.7% |
| Immigrants | Denmark | 99.1 /100 | #84 | Exceptional 95.7% |
Demographics Similar to Immigrants from Cambodia by 9th Grade
In terms of 9th grade, the demographic groups most similar to Immigrants from Cambodia are Immigrants from Bangladesh (92.4%, a difference of 0.030%), Immigrants from Fiji (92.3%, a difference of 0.030%), Houma (92.3%, a difference of 0.060%), Vietnamese (92.3%, a difference of 0.080%), and Immigrants from Portugal (92.2%, a difference of 0.12%).
| Demographics | Rating | Rank | 9th Grade |
| Guyanese | 0.0 /100 | #303 | Tragic 92.7% |
| Tohono O'odham | 0.0 /100 | #304 | Tragic 92.6% |
| Japanese | 0.0 /100 | #305 | Tragic 92.6% |
| Immigrants | Vietnam | 0.0 /100 | #306 | Tragic 92.6% |
| Immigrants | Immigrants | 0.0 /100 | #307 | Tragic 92.5% |
| Immigrants | Guyana | 0.0 /100 | #308 | Tragic 92.5% |
| Immigrants | Bangladesh | 0.0 /100 | #309 | Tragic 92.4% |
| Immigrants | Cambodia | 0.0 /100 | #310 | Tragic 92.4% |
| Immigrants | Fiji | 0.0 /100 | #311 | Tragic 92.3% |
| Houma | 0.0 /100 | #312 | Tragic 92.3% |
| Vietnamese | 0.0 /100 | #313 | Tragic 92.3% |
| Immigrants | Portugal | 0.0 /100 | #314 | Tragic 92.2% |
| Immigrants | Caribbean | 0.0 /100 | #315 | Tragic 92.2% |
| Cape Verdeans | 0.0 /100 | #316 | Tragic 92.2% |
| Immigrants | Cuba | 0.0 /100 | #317 | Tragic 92.2% |