Somali vs Immigrants from Cambodia 9th Grade
COMPARE
Somali
Immigrants from Cambodia
9th Grade
9th Grade Comparison
Somalis
Immigrants from Cambodia
94.3%
9TH GRADE
2.9/ 100
METRIC RATING
236th/ 347
METRIC RANK
92.4%
9TH GRADE
0.0/ 100
METRIC RATING
310th/ 347
METRIC RANK
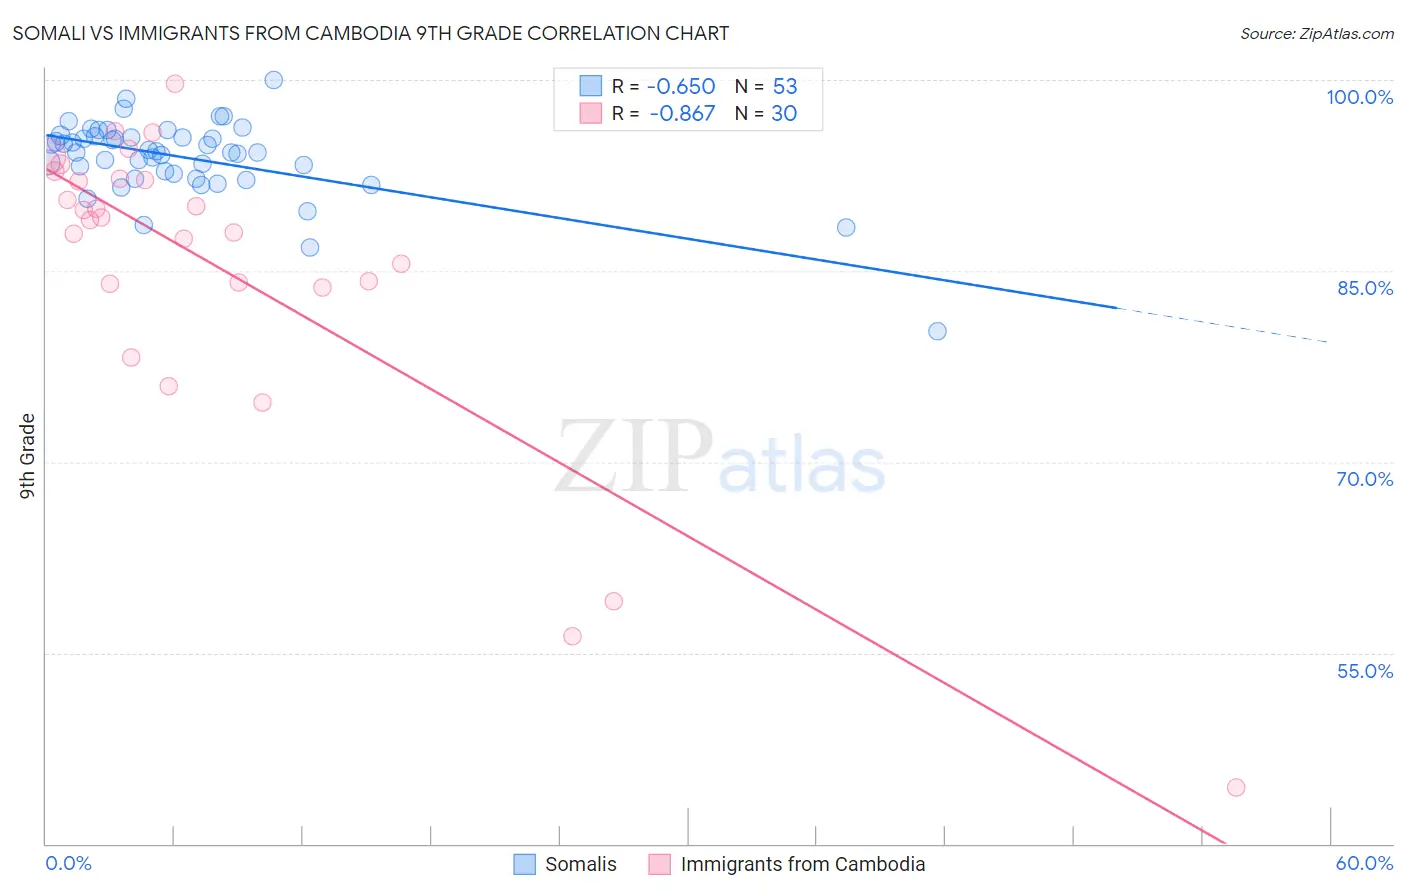
Somali vs Immigrants from Cambodia 9th Grade Correlation Chart
The statistical analysis conducted on geographies consisting of 99,330,527 people shows a significant negative correlation between the proportion of Somalis and percentage of population with at least 9th grade education in the United States with a correlation coefficient (R) of -0.650 and weighted average of 94.3%. Similarly, the statistical analysis conducted on geographies consisting of 205,153,442 people shows a very strong negative correlation between the proportion of Immigrants from Cambodia and percentage of population with at least 9th grade education in the United States with a correlation coefficient (R) of -0.867 and weighted average of 92.4%, a difference of 2.1%.
9th Grade Correlation Summary
| Measurement | Somali | Immigrants from Cambodia |
| Minimum | 80.2% | 44.4% |
| Maximum | 100.0% | 99.7% |
| Range | 19.8% | 55.2% |
| Mean | 93.9% | 85.2% |
| Median | 94.4% | 89.1% |
| Interquartile 25% (IQ1) | 92.5% | 84.0% |
| Interquartile 75% (IQ3) | 95.5% | 92.2% |
| Interquartile Range (IQR) | 3.1% | 8.2% |
| Standard Deviation (Sample) | 3.1% | 12.4% |
| Standard Deviation (Population) | 3.1% | 12.2% |
Similar Demographics by 9th Grade
Demographics Similar to Somalis by 9th Grade
In terms of 9th grade, the demographic groups most similar to Somalis are Korean (94.3%, a difference of 0.0%), South American Indian (94.3%, a difference of 0.010%), Immigrants from China (94.3%, a difference of 0.010%), Bolivian (94.3%, a difference of 0.020%), and Immigrants from Ethiopia (94.3%, a difference of 0.020%).
| Demographics | Rating | Rank | 9th Grade |
| Immigrants | Southern Europe | 4.5 /100 | #229 | Tragic 94.3% |
| Apache | 4.2 /100 | #230 | Tragic 94.3% |
| Immigrants | Panama | 4.0 /100 | #231 | Tragic 94.3% |
| Immigrants | Africa | 3.9 /100 | #232 | Tragic 94.3% |
| Nigerians | 3.7 /100 | #233 | Tragic 94.3% |
| Costa Ricans | 3.5 /100 | #234 | Tragic 94.3% |
| Bolivians | 3.3 /100 | #235 | Tragic 94.3% |
| Somalis | 2.9 /100 | #236 | Tragic 94.3% |
| Koreans | 2.9 /100 | #237 | Tragic 94.3% |
| South American Indians | 2.8 /100 | #238 | Tragic 94.3% |
| Immigrants | China | 2.8 /100 | #239 | Tragic 94.3% |
| Immigrants | Ethiopia | 2.7 /100 | #240 | Tragic 94.3% |
| Spanish Americans | 2.6 /100 | #241 | Tragic 94.2% |
| Immigrants | Middle Africa | 2.2 /100 | #242 | Tragic 94.2% |
| Immigrants | Cameroon | 2.1 /100 | #243 | Tragic 94.2% |
Demographics Similar to Immigrants from Cambodia by 9th Grade
In terms of 9th grade, the demographic groups most similar to Immigrants from Cambodia are Immigrants from Bangladesh (92.4%, a difference of 0.030%), Immigrants from Fiji (92.3%, a difference of 0.030%), Houma (92.3%, a difference of 0.060%), Vietnamese (92.3%, a difference of 0.080%), and Immigrants from Portugal (92.2%, a difference of 0.12%).
| Demographics | Rating | Rank | 9th Grade |
| Guyanese | 0.0 /100 | #303 | Tragic 92.7% |
| Tohono O'odham | 0.0 /100 | #304 | Tragic 92.6% |
| Japanese | 0.0 /100 | #305 | Tragic 92.6% |
| Immigrants | Vietnam | 0.0 /100 | #306 | Tragic 92.6% |
| Immigrants | Immigrants | 0.0 /100 | #307 | Tragic 92.5% |
| Immigrants | Guyana | 0.0 /100 | #308 | Tragic 92.5% |
| Immigrants | Bangladesh | 0.0 /100 | #309 | Tragic 92.4% |
| Immigrants | Cambodia | 0.0 /100 | #310 | Tragic 92.4% |
| Immigrants | Fiji | 0.0 /100 | #311 | Tragic 92.3% |
| Houma | 0.0 /100 | #312 | Tragic 92.3% |
| Vietnamese | 0.0 /100 | #313 | Tragic 92.3% |
| Immigrants | Portugal | 0.0 /100 | #314 | Tragic 92.2% |
| Immigrants | Caribbean | 0.0 /100 | #315 | Tragic 92.2% |
| Cape Verdeans | 0.0 /100 | #316 | Tragic 92.2% |
| Immigrants | Cuba | 0.0 /100 | #317 | Tragic 92.2% |