German Russian vs Immigrants from Cambodia 9th Grade
COMPARE
German Russian
Immigrants from Cambodia
9th Grade
9th Grade Comparison
German Russians
Immigrants from Cambodia
95.4%
9TH GRADE
96.1/ 100
METRIC RATING
114th/ 347
METRIC RANK
92.4%
9TH GRADE
0.0/ 100
METRIC RATING
310th/ 347
METRIC RANK
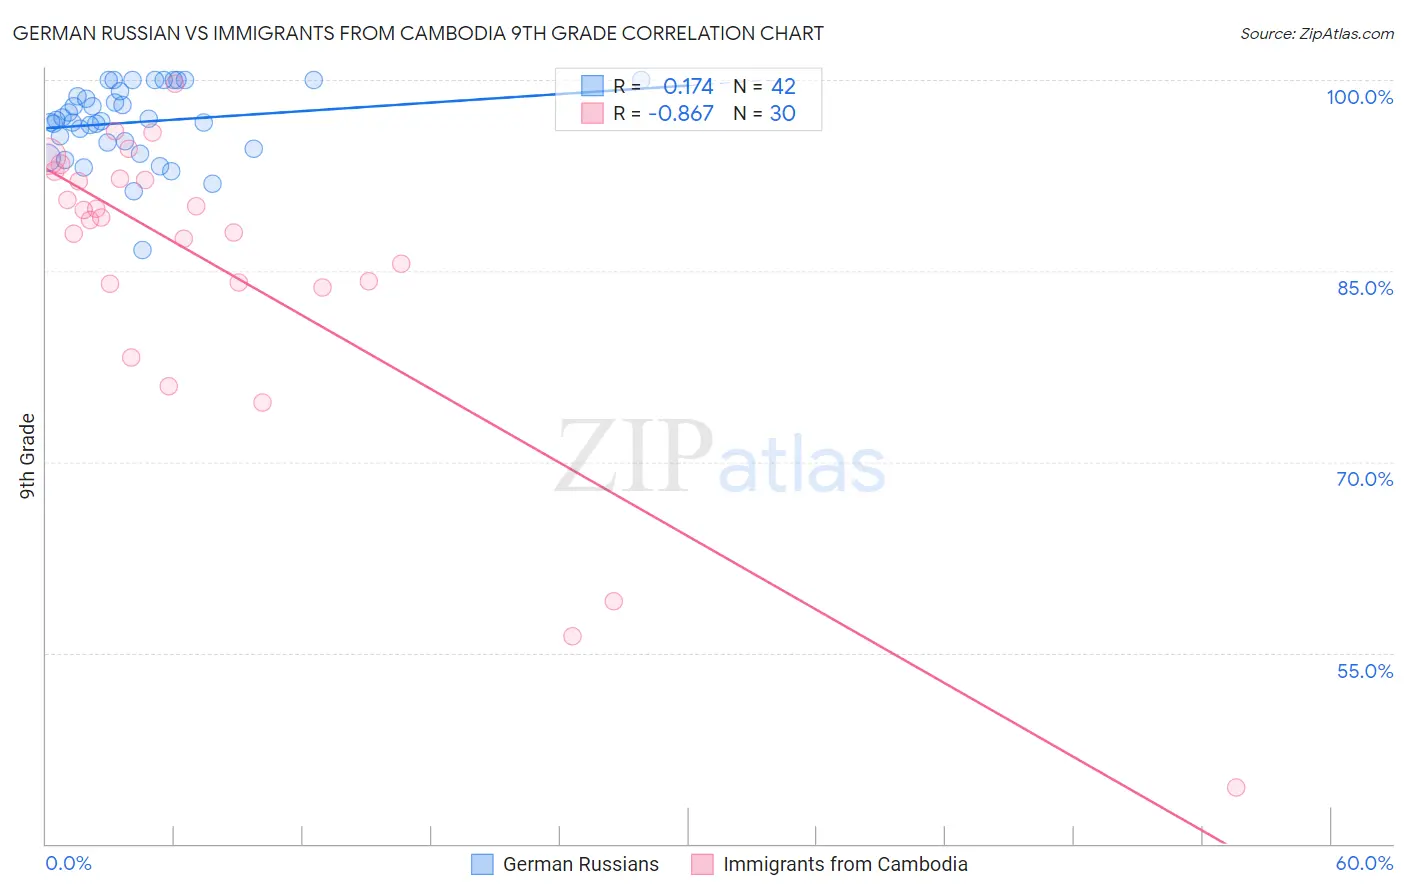
German Russian vs Immigrants from Cambodia 9th Grade Correlation Chart
The statistical analysis conducted on geographies consisting of 96,461,461 people shows a poor positive correlation between the proportion of German Russians and percentage of population with at least 9th grade education in the United States with a correlation coefficient (R) of 0.174 and weighted average of 95.4%. Similarly, the statistical analysis conducted on geographies consisting of 205,153,442 people shows a very strong negative correlation between the proportion of Immigrants from Cambodia and percentage of population with at least 9th grade education in the United States with a correlation coefficient (R) of -0.867 and weighted average of 92.4%, a difference of 3.3%.
9th Grade Correlation Summary
| Measurement | German Russian | Immigrants from Cambodia |
| Minimum | 86.6% | 44.4% |
| Maximum | 100.0% | 99.7% |
| Range | 13.4% | 55.2% |
| Mean | 96.7% | 85.2% |
| Median | 96.8% | 89.1% |
| Interquartile 25% (IQ1) | 95.1% | 84.0% |
| Interquartile 75% (IQ3) | 99.1% | 92.2% |
| Interquartile Range (IQR) | 4.0% | 8.2% |
| Standard Deviation (Sample) | 3.0% | 12.4% |
| Standard Deviation (Population) | 2.9% | 12.2% |
Similar Demographics by 9th Grade
Demographics Similar to German Russians by 9th Grade
In terms of 9th grade, the demographic groups most similar to German Russians are Iroquois (95.4%, a difference of 0.0%), Burmese (95.4%, a difference of 0.0%), Cherokee (95.4%, a difference of 0.010%), Immigrants from Croatia (95.4%, a difference of 0.010%), and Immigrants from Europe (95.4%, a difference of 0.020%).
| Demographics | Rating | Rank | 9th Grade |
| Immigrants | Zimbabwe | 96.9 /100 | #107 | Exceptional 95.5% |
| Chickasaw | 96.8 /100 | #108 | Exceptional 95.5% |
| Osage | 96.8 /100 | #109 | Exceptional 95.5% |
| Immigrants | Bulgaria | 96.7 /100 | #110 | Exceptional 95.5% |
| Cherokee | 96.3 /100 | #111 | Exceptional 95.4% |
| Immigrants | Croatia | 96.2 /100 | #112 | Exceptional 95.4% |
| Iroquois | 96.2 /100 | #113 | Exceptional 95.4% |
| German Russians | 96.1 /100 | #114 | Exceptional 95.4% |
| Burmese | 96.0 /100 | #115 | Exceptional 95.4% |
| Immigrants | Europe | 95.7 /100 | #116 | Exceptional 95.4% |
| Immigrants | Romania | 95.6 /100 | #117 | Exceptional 95.4% |
| Immigrants | Turkey | 95.6 /100 | #118 | Exceptional 95.4% |
| Soviet Union | 95.6 /100 | #119 | Exceptional 95.4% |
| Cambodians | 95.6 /100 | #120 | Exceptional 95.4% |
| Cree | 95.5 /100 | #121 | Exceptional 95.4% |
Demographics Similar to Immigrants from Cambodia by 9th Grade
In terms of 9th grade, the demographic groups most similar to Immigrants from Cambodia are Immigrants from Bangladesh (92.4%, a difference of 0.030%), Immigrants from Fiji (92.3%, a difference of 0.030%), Houma (92.3%, a difference of 0.060%), Vietnamese (92.3%, a difference of 0.080%), and Immigrants from Portugal (92.2%, a difference of 0.12%).
| Demographics | Rating | Rank | 9th Grade |
| Guyanese | 0.0 /100 | #303 | Tragic 92.7% |
| Tohono O'odham | 0.0 /100 | #304 | Tragic 92.6% |
| Japanese | 0.0 /100 | #305 | Tragic 92.6% |
| Immigrants | Vietnam | 0.0 /100 | #306 | Tragic 92.6% |
| Immigrants | Immigrants | 0.0 /100 | #307 | Tragic 92.5% |
| Immigrants | Guyana | 0.0 /100 | #308 | Tragic 92.5% |
| Immigrants | Bangladesh | 0.0 /100 | #309 | Tragic 92.4% |
| Immigrants | Cambodia | 0.0 /100 | #310 | Tragic 92.4% |
| Immigrants | Fiji | 0.0 /100 | #311 | Tragic 92.3% |
| Houma | 0.0 /100 | #312 | Tragic 92.3% |
| Vietnamese | 0.0 /100 | #313 | Tragic 92.3% |
| Immigrants | Portugal | 0.0 /100 | #314 | Tragic 92.2% |
| Immigrants | Caribbean | 0.0 /100 | #315 | Tragic 92.2% |
| Cape Verdeans | 0.0 /100 | #316 | Tragic 92.2% |
| Immigrants | Cuba | 0.0 /100 | #317 | Tragic 92.2% |