White/Caucasian vs Trinidadian and Tobagonian 9th Grade
COMPARE
White/Caucasian
Trinidadian and Tobagonian
9th Grade
9th Grade Comparison
Whites/Caucasians
Trinidadians and Tobagonians
95.8%
9TH GRADE
99.4/ 100
METRIC RATING
77th/ 347
METRIC RANK
93.7%
9TH GRADE
0.1/ 100
METRIC RATING
279th/ 347
METRIC RANK
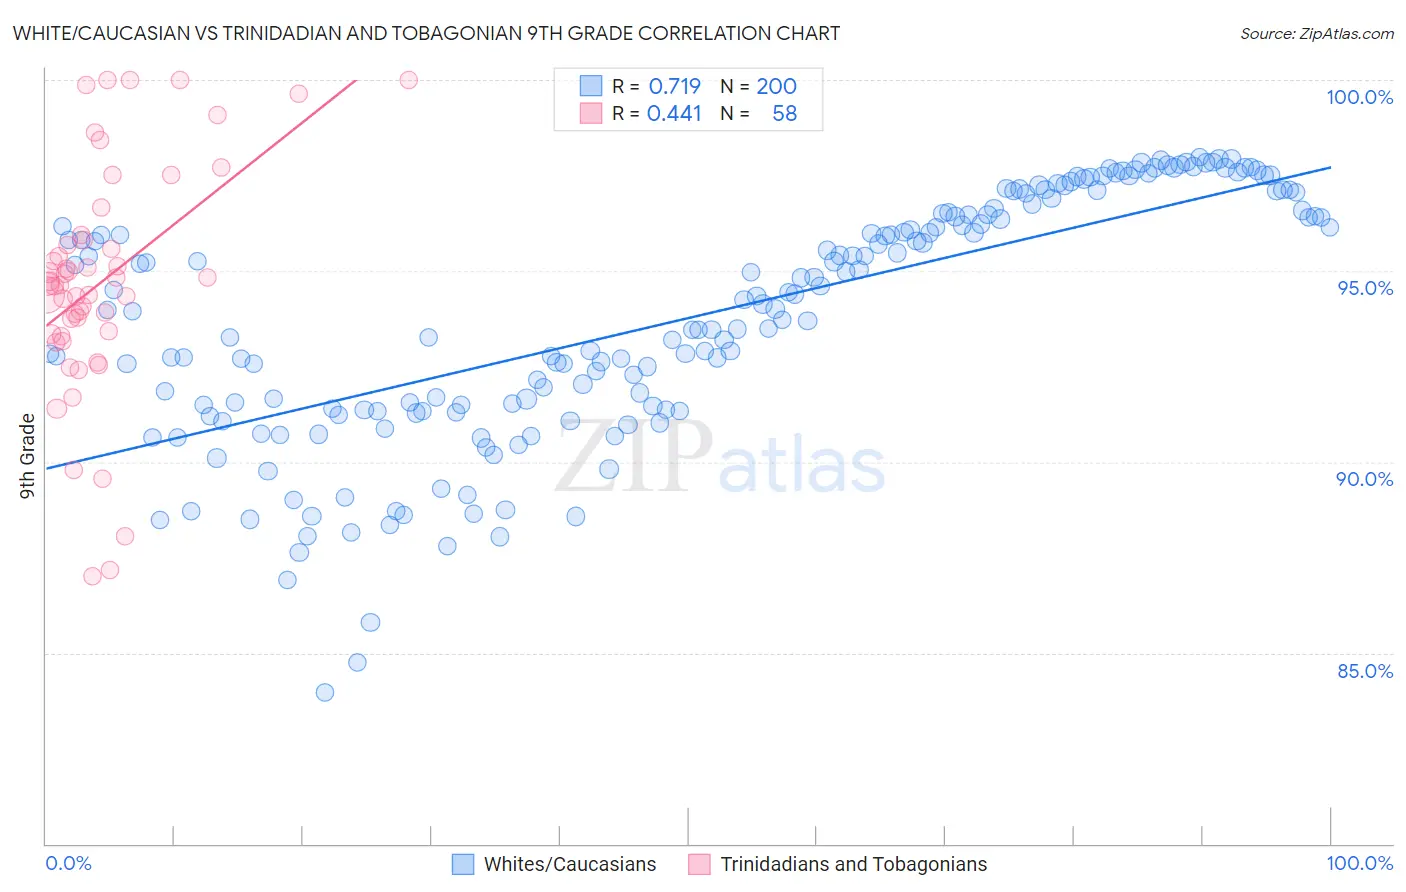
White/Caucasian vs Trinidadian and Tobagonian 9th Grade Correlation Chart
The statistical analysis conducted on geographies consisting of 585,245,517 people shows a strong positive correlation between the proportion of Whites/Caucasians and percentage of population with at least 9th grade education in the United States with a correlation coefficient (R) of 0.719 and weighted average of 95.8%. Similarly, the statistical analysis conducted on geographies consisting of 219,881,170 people shows a moderate positive correlation between the proportion of Trinidadians and Tobagonians and percentage of population with at least 9th grade education in the United States with a correlation coefficient (R) of 0.441 and weighted average of 93.7%, a difference of 2.2%.
9th Grade Correlation Summary
| Measurement | White/Caucasian | Trinidadian and Tobagonian |
| Minimum | 84.0% | 87.0% |
| Maximum | 98.0% | 100.0% |
| Range | 14.0% | 13.0% |
| Mean | 93.8% | 94.7% |
| Median | 94.1% | 94.6% |
| Interquartile 25% (IQ1) | 91.4% | 93.3% |
| Interquartile 75% (IQ3) | 96.5% | 95.8% |
| Interquartile Range (IQR) | 5.1% | 2.5% |
| Standard Deviation (Sample) | 3.2% | 3.0% |
| Standard Deviation (Population) | 3.2% | 3.0% |
Similar Demographics by 9th Grade
Demographics Similar to Whites/Caucasians by 9th Grade
In terms of 9th grade, the demographic groups most similar to Whites/Caucasians are Immigrants from South Africa (95.8%, a difference of 0.0%), Inupiat (95.8%, a difference of 0.010%), Immigrants from Sweden (95.8%, a difference of 0.010%), Thai (95.8%, a difference of 0.020%), and Immigrants from Belgium (95.8%, a difference of 0.030%).
| Demographics | Rating | Rank | 9th Grade |
| Immigrants | Australia | 99.5 /100 | #70 | Exceptional 95.8% |
| Immigrants | Belgium | 99.5 /100 | #71 | Exceptional 95.8% |
| Turks | 99.5 /100 | #72 | Exceptional 95.8% |
| Immigrants | Singapore | 99.5 /100 | #73 | Exceptional 95.8% |
| Thais | 99.5 /100 | #74 | Exceptional 95.8% |
| Inupiat | 99.5 /100 | #75 | Exceptional 95.8% |
| Immigrants | Sweden | 99.5 /100 | #76 | Exceptional 95.8% |
| Whites/Caucasians | 99.4 /100 | #77 | Exceptional 95.8% |
| Immigrants | South Africa | 99.4 /100 | #78 | Exceptional 95.8% |
| Romanians | 99.3 /100 | #79 | Exceptional 95.7% |
| Bhutanese | 99.3 /100 | #80 | Exceptional 95.7% |
| Arapaho | 99.3 /100 | #81 | Exceptional 95.7% |
| Puget Sound Salish | 99.2 /100 | #82 | Exceptional 95.7% |
| Swiss | 99.2 /100 | #83 | Exceptional 95.7% |
| Immigrants | Denmark | 99.1 /100 | #84 | Exceptional 95.7% |
Demographics Similar to Trinidadians and Tobagonians by 9th Grade
In terms of 9th grade, the demographic groups most similar to Trinidadians and Tobagonians are Immigrants from Philippines (93.7%, a difference of 0.060%), Immigrants from Eritrea (93.7%, a difference of 0.060%), West Indian (93.7%, a difference of 0.070%), Immigrants from Colombia (93.8%, a difference of 0.080%), and Taiwanese (93.6%, a difference of 0.080%).
| Demographics | Rating | Rank | 9th Grade |
| Immigrants | Western Africa | 0.2 /100 | #272 | Tragic 93.8% |
| Immigrants | South America | 0.2 /100 | #273 | Tragic 93.8% |
| Peruvians | 0.2 /100 | #274 | Tragic 93.8% |
| Immigrants | Colombia | 0.2 /100 | #275 | Tragic 93.8% |
| West Indians | 0.2 /100 | #276 | Tragic 93.7% |
| Immigrants | Philippines | 0.1 /100 | #277 | Tragic 93.7% |
| Immigrants | Eritrea | 0.1 /100 | #278 | Tragic 93.7% |
| Trinidadians and Tobagonians | 0.1 /100 | #279 | Tragic 93.7% |
| Taiwanese | 0.1 /100 | #280 | Tragic 93.6% |
| Immigrants | Trinidad and Tobago | 0.1 /100 | #281 | Tragic 93.6% |
| Malaysians | 0.0 /100 | #282 | Tragic 93.5% |
| Barbadians | 0.0 /100 | #283 | Tragic 93.5% |
| Bangladeshis | 0.0 /100 | #284 | Tragic 93.4% |
| Immigrants | Peru | 0.0 /100 | #285 | Tragic 93.4% |
| Immigrants | Barbados | 0.0 /100 | #286 | Tragic 93.4% |