Marshallese vs Immigrants from Cambodia 9th Grade
COMPARE
Marshallese
Immigrants from Cambodia
9th Grade
9th Grade Comparison
Marshallese
Immigrants from Cambodia
94.7%
9TH GRADE
27.9/ 100
METRIC RATING
195th/ 347
METRIC RANK
92.4%
9TH GRADE
0.0/ 100
METRIC RATING
310th/ 347
METRIC RANK
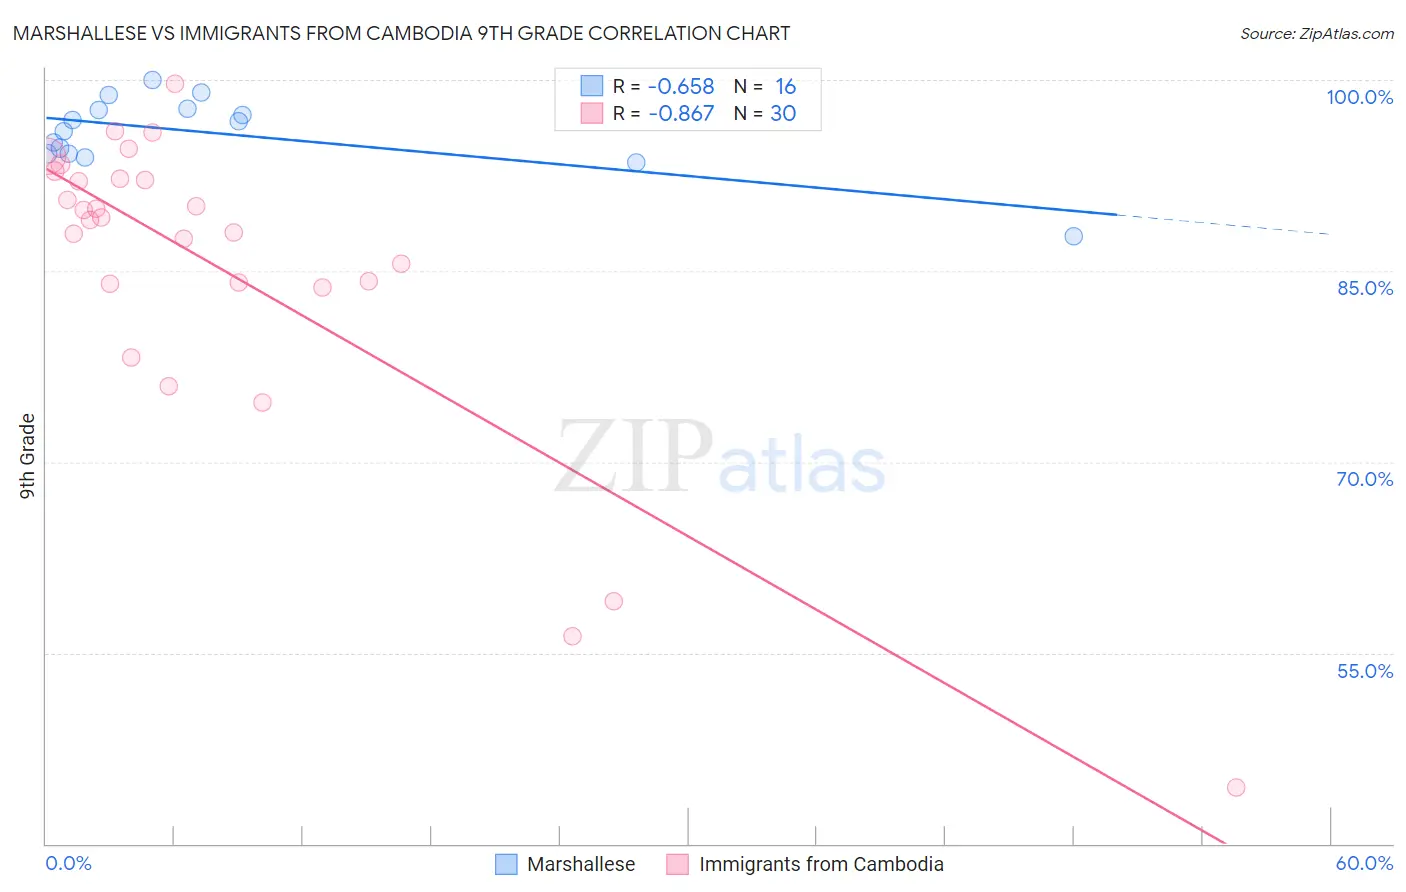
Marshallese vs Immigrants from Cambodia 9th Grade Correlation Chart
The statistical analysis conducted on geographies consisting of 14,761,315 people shows a significant negative correlation between the proportion of Marshallese and percentage of population with at least 9th grade education in the United States with a correlation coefficient (R) of -0.658 and weighted average of 94.7%. Similarly, the statistical analysis conducted on geographies consisting of 205,153,442 people shows a very strong negative correlation between the proportion of Immigrants from Cambodia and percentage of population with at least 9th grade education in the United States with a correlation coefficient (R) of -0.867 and weighted average of 92.4%, a difference of 2.5%.
9th Grade Correlation Summary
| Measurement | Marshallese | Immigrants from Cambodia |
| Minimum | 87.7% | 44.4% |
| Maximum | 100.0% | 99.7% |
| Range | 12.3% | 55.2% |
| Mean | 95.8% | 85.2% |
| Median | 96.4% | 89.1% |
| Interquartile 25% (IQ1) | 94.2% | 84.0% |
| Interquartile 75% (IQ3) | 97.7% | 92.2% |
| Interquartile Range (IQR) | 3.5% | 8.2% |
| Standard Deviation (Sample) | 2.9% | 12.4% |
| Standard Deviation (Population) | 2.8% | 12.2% |
Similar Demographics by 9th Grade
Demographics Similar to Marshallese by 9th Grade
In terms of 9th grade, the demographic groups most similar to Marshallese are Panamanian (94.7%, a difference of 0.010%), Immigrants from Lebanon (94.7%, a difference of 0.010%), Immigrants from Northern Africa (94.7%, a difference of 0.020%), Paraguayan (94.7%, a difference of 0.020%), and Immigrants from Micronesia (94.7%, a difference of 0.030%).
| Demographics | Rating | Rank | 9th Grade |
| Immigrants | Albania | 34.5 /100 | #188 | Fair 94.8% |
| Immigrants | Argentina | 34.4 /100 | #189 | Fair 94.8% |
| Sudanese | 32.7 /100 | #190 | Fair 94.7% |
| Assyrians/Chaldeans/Syriacs | 32.0 /100 | #191 | Fair 94.7% |
| Immigrants | Northern Africa | 30.7 /100 | #192 | Fair 94.7% |
| Paraguayans | 30.1 /100 | #193 | Fair 94.7% |
| Panamanians | 29.0 /100 | #194 | Fair 94.7% |
| Marshallese | 27.9 /100 | #195 | Fair 94.7% |
| Immigrants | Lebanon | 27.2 /100 | #196 | Fair 94.7% |
| Immigrants | Micronesia | 24.7 /100 | #197 | Fair 94.7% |
| Hawaiians | 22.7 /100 | #198 | Fair 94.7% |
| Laotians | 21.0 /100 | #199 | Fair 94.6% |
| Immigrants | Zaire | 20.6 /100 | #200 | Fair 94.6% |
| Blacks/African Americans | 20.5 /100 | #201 | Fair 94.6% |
| Immigrants | Eastern Asia | 19.8 /100 | #202 | Poor 94.6% |
Demographics Similar to Immigrants from Cambodia by 9th Grade
In terms of 9th grade, the demographic groups most similar to Immigrants from Cambodia are Immigrants from Bangladesh (92.4%, a difference of 0.030%), Immigrants from Fiji (92.3%, a difference of 0.030%), Houma (92.3%, a difference of 0.060%), Vietnamese (92.3%, a difference of 0.080%), and Immigrants from Portugal (92.2%, a difference of 0.12%).
| Demographics | Rating | Rank | 9th Grade |
| Guyanese | 0.0 /100 | #303 | Tragic 92.7% |
| Tohono O'odham | 0.0 /100 | #304 | Tragic 92.6% |
| Japanese | 0.0 /100 | #305 | Tragic 92.6% |
| Immigrants | Vietnam | 0.0 /100 | #306 | Tragic 92.6% |
| Immigrants | Immigrants | 0.0 /100 | #307 | Tragic 92.5% |
| Immigrants | Guyana | 0.0 /100 | #308 | Tragic 92.5% |
| Immigrants | Bangladesh | 0.0 /100 | #309 | Tragic 92.4% |
| Immigrants | Cambodia | 0.0 /100 | #310 | Tragic 92.4% |
| Immigrants | Fiji | 0.0 /100 | #311 | Tragic 92.3% |
| Houma | 0.0 /100 | #312 | Tragic 92.3% |
| Vietnamese | 0.0 /100 | #313 | Tragic 92.3% |
| Immigrants | Portugal | 0.0 /100 | #314 | Tragic 92.2% |
| Immigrants | Caribbean | 0.0 /100 | #315 | Tragic 92.2% |
| Cape Verdeans | 0.0 /100 | #316 | Tragic 92.2% |
| Immigrants | Cuba | 0.0 /100 | #317 | Tragic 92.2% |