Zimbabwean vs Immigrants from Cambodia 9th Grade
COMPARE
Zimbabwean
Immigrants from Cambodia
9th Grade
9th Grade Comparison
Zimbabweans
Immigrants from Cambodia
95.9%
9TH GRADE
99.7/ 100
METRIC RATING
64th/ 347
METRIC RANK
92.4%
9TH GRADE
0.0/ 100
METRIC RATING
310th/ 347
METRIC RANK
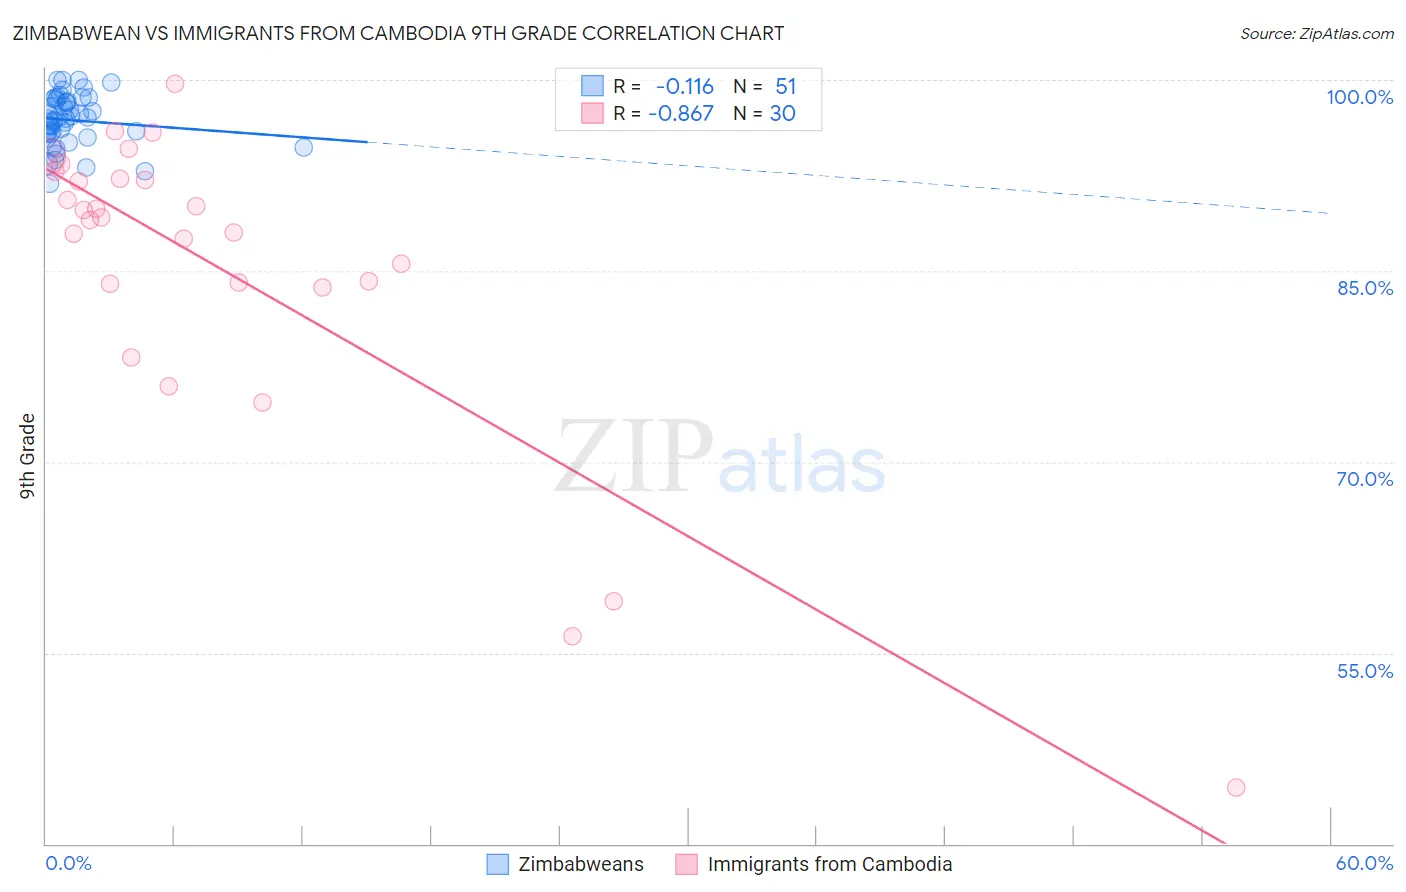
Zimbabwean vs Immigrants from Cambodia 9th Grade Correlation Chart
The statistical analysis conducted on geographies consisting of 69,203,423 people shows a poor negative correlation between the proportion of Zimbabweans and percentage of population with at least 9th grade education in the United States with a correlation coefficient (R) of -0.116 and weighted average of 95.9%. Similarly, the statistical analysis conducted on geographies consisting of 205,153,442 people shows a very strong negative correlation between the proportion of Immigrants from Cambodia and percentage of population with at least 9th grade education in the United States with a correlation coefficient (R) of -0.867 and weighted average of 92.4%, a difference of 3.8%.
9th Grade Correlation Summary
| Measurement | Zimbabwean | Immigrants from Cambodia |
| Minimum | 91.8% | 44.4% |
| Maximum | 100.0% | 99.7% |
| Range | 8.2% | 55.2% |
| Mean | 96.8% | 85.2% |
| Median | 97.0% | 89.1% |
| Interquartile 25% (IQ1) | 95.8% | 84.0% |
| Interquartile 75% (IQ3) | 98.4% | 92.2% |
| Interquartile Range (IQR) | 2.6% | 8.2% |
| Standard Deviation (Sample) | 2.0% | 12.4% |
| Standard Deviation (Population) | 1.9% | 12.2% |
Similar Demographics by 9th Grade
Demographics Similar to Zimbabweans by 9th Grade
In terms of 9th grade, the demographic groups most similar to Zimbabweans are Canadian (95.9%, a difference of 0.010%), Immigrants from England (95.9%, a difference of 0.010%), Immigrants from Netherlands (95.8%, a difference of 0.030%), Cypriot (95.8%, a difference of 0.030%), and Immigrants from Ireland (95.8%, a difference of 0.040%).
| Demographics | Rating | Rank | 9th Grade |
| Macedonians | 99.8 /100 | #57 | Exceptional 96.0% |
| Aleuts | 99.8 /100 | #58 | Exceptional 96.0% |
| New Zealanders | 99.8 /100 | #59 | Exceptional 95.9% |
| Native Hawaiians | 99.8 /100 | #60 | Exceptional 95.9% |
| Sioux | 99.8 /100 | #61 | Exceptional 95.9% |
| Ukrainians | 99.7 /100 | #62 | Exceptional 95.9% |
| Canadians | 99.7 /100 | #63 | Exceptional 95.9% |
| Zimbabweans | 99.7 /100 | #64 | Exceptional 95.9% |
| Immigrants | England | 99.6 /100 | #65 | Exceptional 95.9% |
| Immigrants | Netherlands | 99.6 /100 | #66 | Exceptional 95.8% |
| Cypriots | 99.6 /100 | #67 | Exceptional 95.8% |
| Immigrants | Ireland | 99.6 /100 | #68 | Exceptional 95.8% |
| Immigrants | Lithuania | 99.6 /100 | #69 | Exceptional 95.8% |
| Immigrants | Australia | 99.5 /100 | #70 | Exceptional 95.8% |
| Immigrants | Belgium | 99.5 /100 | #71 | Exceptional 95.8% |
Demographics Similar to Immigrants from Cambodia by 9th Grade
In terms of 9th grade, the demographic groups most similar to Immigrants from Cambodia are Immigrants from Bangladesh (92.4%, a difference of 0.030%), Immigrants from Fiji (92.3%, a difference of 0.030%), Houma (92.3%, a difference of 0.060%), Vietnamese (92.3%, a difference of 0.080%), and Immigrants from Portugal (92.2%, a difference of 0.12%).
| Demographics | Rating | Rank | 9th Grade |
| Guyanese | 0.0 /100 | #303 | Tragic 92.7% |
| Tohono O'odham | 0.0 /100 | #304 | Tragic 92.6% |
| Japanese | 0.0 /100 | #305 | Tragic 92.6% |
| Immigrants | Vietnam | 0.0 /100 | #306 | Tragic 92.6% |
| Immigrants | Immigrants | 0.0 /100 | #307 | Tragic 92.5% |
| Immigrants | Guyana | 0.0 /100 | #308 | Tragic 92.5% |
| Immigrants | Bangladesh | 0.0 /100 | #309 | Tragic 92.4% |
| Immigrants | Cambodia | 0.0 /100 | #310 | Tragic 92.4% |
| Immigrants | Fiji | 0.0 /100 | #311 | Tragic 92.3% |
| Houma | 0.0 /100 | #312 | Tragic 92.3% |
| Vietnamese | 0.0 /100 | #313 | Tragic 92.3% |
| Immigrants | Portugal | 0.0 /100 | #314 | Tragic 92.2% |
| Immigrants | Caribbean | 0.0 /100 | #315 | Tragic 92.2% |
| Cape Verdeans | 0.0 /100 | #316 | Tragic 92.2% |
| Immigrants | Cuba | 0.0 /100 | #317 | Tragic 92.2% |