White/Caucasian vs Immigrants from Serbia 9th Grade
COMPARE
White/Caucasian
Immigrants from Serbia
9th Grade
9th Grade Comparison
Whites/Caucasians
Immigrants from Serbia
95.8%
9TH GRADE
99.4/ 100
METRIC RATING
77th/ 347
METRIC RANK
95.4%
9TH GRADE
94.4/ 100
METRIC RATING
126th/ 347
METRIC RANK
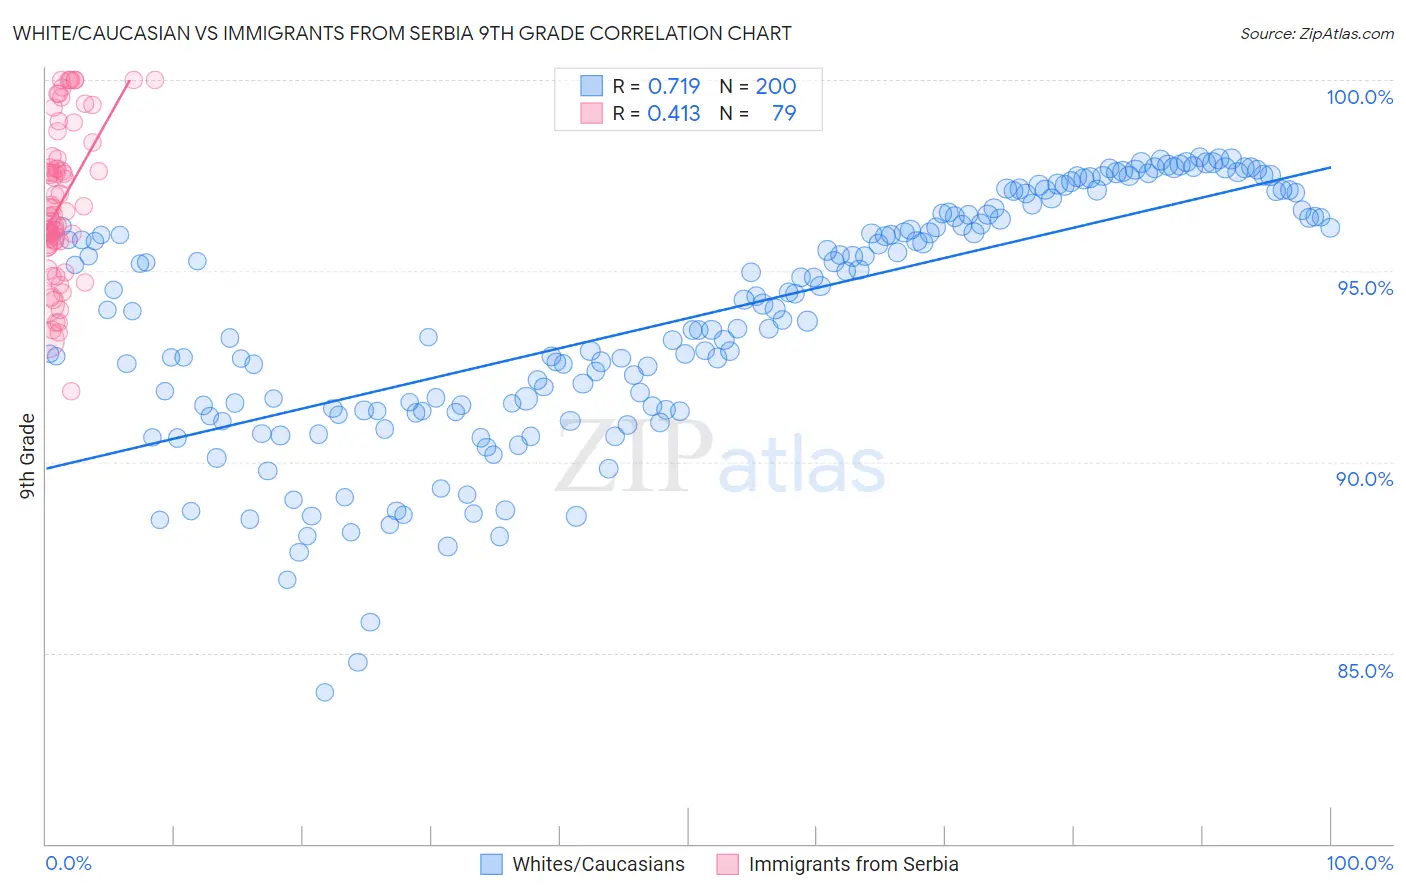
White/Caucasian vs Immigrants from Serbia 9th Grade Correlation Chart
The statistical analysis conducted on geographies consisting of 585,245,517 people shows a strong positive correlation between the proportion of Whites/Caucasians and percentage of population with at least 9th grade education in the United States with a correlation coefficient (R) of 0.719 and weighted average of 95.8%. Similarly, the statistical analysis conducted on geographies consisting of 131,729,423 people shows a moderate positive correlation between the proportion of Immigrants from Serbia and percentage of population with at least 9th grade education in the United States with a correlation coefficient (R) of 0.413 and weighted average of 95.4%, a difference of 0.43%.
9th Grade Correlation Summary
| Measurement | White/Caucasian | Immigrants from Serbia |
| Minimum | 84.0% | 91.9% |
| Maximum | 98.0% | 100.0% |
| Range | 14.0% | 8.1% |
| Mean | 93.8% | 96.8% |
| Median | 94.1% | 96.6% |
| Interquartile 25% (IQ1) | 91.4% | 95.7% |
| Interquartile 75% (IQ3) | 96.5% | 98.0% |
| Interquartile Range (IQR) | 5.1% | 2.3% |
| Standard Deviation (Sample) | 3.2% | 2.0% |
| Standard Deviation (Population) | 3.2% | 2.0% |
Similar Demographics by 9th Grade
Demographics Similar to Whites/Caucasians by 9th Grade
In terms of 9th grade, the demographic groups most similar to Whites/Caucasians are Immigrants from South Africa (95.8%, a difference of 0.0%), Inupiat (95.8%, a difference of 0.010%), Immigrants from Sweden (95.8%, a difference of 0.010%), Thai (95.8%, a difference of 0.020%), and Immigrants from Belgium (95.8%, a difference of 0.030%).
| Demographics | Rating | Rank | 9th Grade |
| Immigrants | Australia | 99.5 /100 | #70 | Exceptional 95.8% |
| Immigrants | Belgium | 99.5 /100 | #71 | Exceptional 95.8% |
| Turks | 99.5 /100 | #72 | Exceptional 95.8% |
| Immigrants | Singapore | 99.5 /100 | #73 | Exceptional 95.8% |
| Thais | 99.5 /100 | #74 | Exceptional 95.8% |
| Inupiat | 99.5 /100 | #75 | Exceptional 95.8% |
| Immigrants | Sweden | 99.5 /100 | #76 | Exceptional 95.8% |
| Whites/Caucasians | 99.4 /100 | #77 | Exceptional 95.8% |
| Immigrants | South Africa | 99.4 /100 | #78 | Exceptional 95.8% |
| Romanians | 99.3 /100 | #79 | Exceptional 95.7% |
| Bhutanese | 99.3 /100 | #80 | Exceptional 95.7% |
| Arapaho | 99.3 /100 | #81 | Exceptional 95.7% |
| Puget Sound Salish | 99.2 /100 | #82 | Exceptional 95.7% |
| Swiss | 99.2 /100 | #83 | Exceptional 95.7% |
| Immigrants | Denmark | 99.1 /100 | #84 | Exceptional 95.7% |
Demographics Similar to Immigrants from Serbia by 9th Grade
In terms of 9th grade, the demographic groups most similar to Immigrants from Serbia are Palestinian (95.4%, a difference of 0.0%), Immigrants from Hungary (95.4%, a difference of 0.010%), Basque (95.4%, a difference of 0.010%), Immigrants from South Central Asia (95.4%, a difference of 0.020%), and Kiowa (95.4%, a difference of 0.030%).
| Demographics | Rating | Rank | 9th Grade |
| Soviet Union | 95.6 /100 | #119 | Exceptional 95.4% |
| Cambodians | 95.6 /100 | #120 | Exceptional 95.4% |
| Cree | 95.5 /100 | #121 | Exceptional 95.4% |
| Immigrants | Kuwait | 95.5 /100 | #122 | Exceptional 95.4% |
| Kiowa | 95.3 /100 | #123 | Exceptional 95.4% |
| Shoshone | 95.3 /100 | #124 | Exceptional 95.4% |
| Immigrants | South Central Asia | 95.1 /100 | #125 | Exceptional 95.4% |
| Immigrants | Serbia | 94.4 /100 | #126 | Exceptional 95.4% |
| Palestinians | 94.3 /100 | #127 | Exceptional 95.4% |
| Immigrants | Hungary | 94.2 /100 | #128 | Exceptional 95.4% |
| Basques | 94.1 /100 | #129 | Exceptional 95.4% |
| Jordanians | 93.5 /100 | #130 | Exceptional 95.3% |
| Immigrants | North Macedonia | 92.3 /100 | #131 | Exceptional 95.3% |
| Immigrants | Nonimmigrants | 92.0 /100 | #132 | Exceptional 95.3% |
| Israelis | 90.4 /100 | #133 | Exceptional 95.3% |