White/Caucasian vs Bahamian 9th Grade
COMPARE
White/Caucasian
Bahamian
9th Grade
9th Grade Comparison
Whites/Caucasians
Bahamians
95.8%
9TH GRADE
99.4/ 100
METRIC RATING
77th/ 347
METRIC RANK
94.4%
9TH GRADE
7.0/ 100
METRIC RATING
223rd/ 347
METRIC RANK
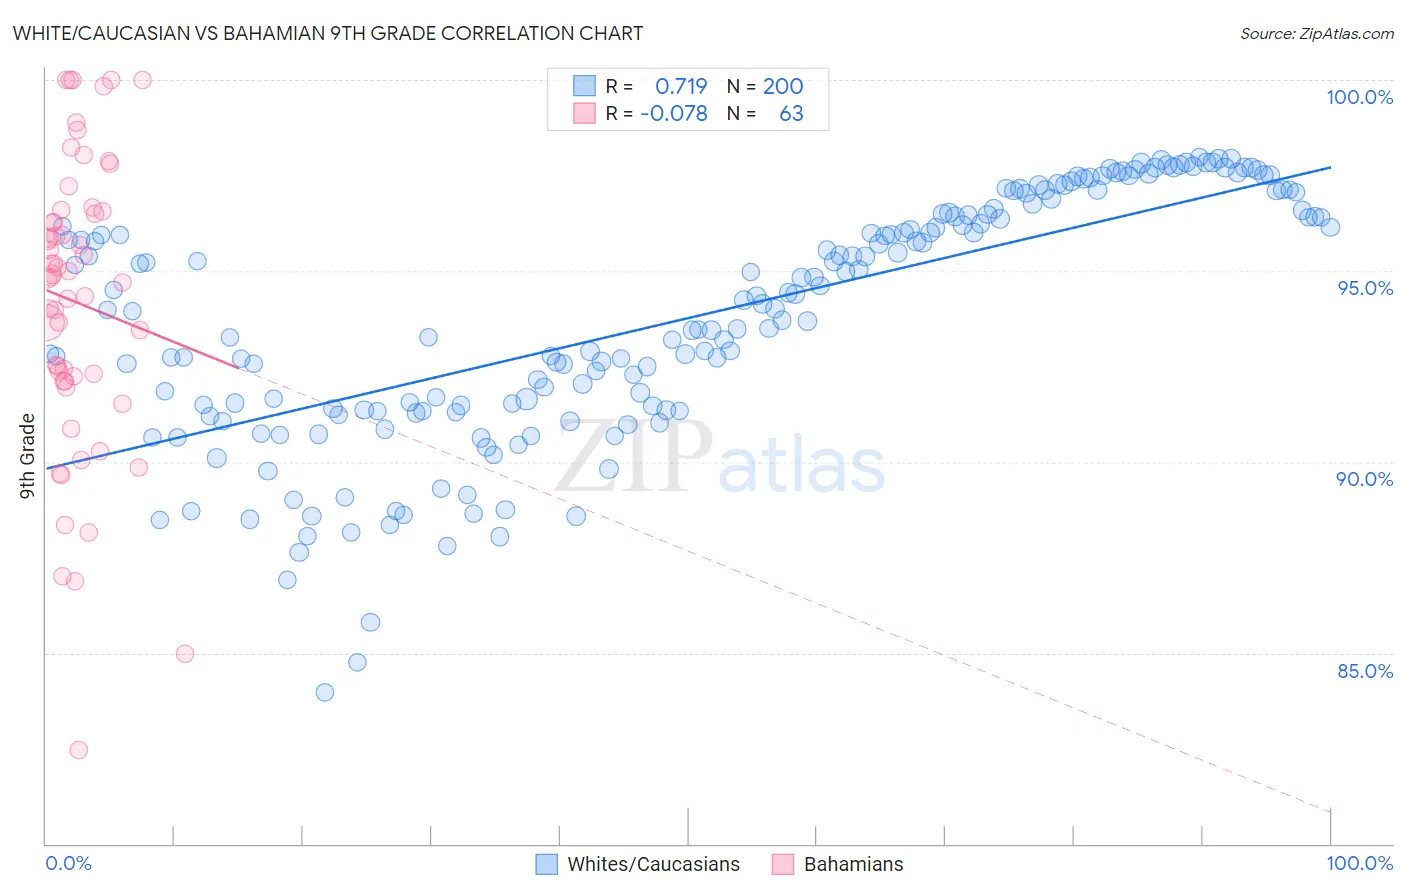
White/Caucasian vs Bahamian 9th Grade Correlation Chart
The statistical analysis conducted on geographies consisting of 585,245,517 people shows a strong positive correlation between the proportion of Whites/Caucasians and percentage of population with at least 9th grade education in the United States with a correlation coefficient (R) of 0.719 and weighted average of 95.8%. Similarly, the statistical analysis conducted on geographies consisting of 112,698,819 people shows a slight negative correlation between the proportion of Bahamians and percentage of population with at least 9th grade education in the United States with a correlation coefficient (R) of -0.078 and weighted average of 94.4%, a difference of 1.4%.
9th Grade Correlation Summary
| Measurement | White/Caucasian | Bahamian |
| Minimum | 84.0% | 82.5% |
| Maximum | 98.0% | 100.0% |
| Range | 14.0% | 17.5% |
| Mean | 93.8% | 94.2% |
| Median | 94.1% | 94.8% |
| Interquartile 25% (IQ1) | 91.4% | 92.1% |
| Interquartile 75% (IQ3) | 96.5% | 96.6% |
| Interquartile Range (IQR) | 5.1% | 4.4% |
| Standard Deviation (Sample) | 3.2% | 3.8% |
| Standard Deviation (Population) | 3.2% | 3.8% |
Similar Demographics by 9th Grade
Demographics Similar to Whites/Caucasians by 9th Grade
In terms of 9th grade, the demographic groups most similar to Whites/Caucasians are Immigrants from South Africa (95.8%, a difference of 0.0%), Inupiat (95.8%, a difference of 0.010%), Immigrants from Sweden (95.8%, a difference of 0.010%), Thai (95.8%, a difference of 0.020%), and Immigrants from Belgium (95.8%, a difference of 0.030%).
| Demographics | Rating | Rank | 9th Grade |
| Immigrants | Australia | 99.5 /100 | #70 | Exceptional 95.8% |
| Immigrants | Belgium | 99.5 /100 | #71 | Exceptional 95.8% |
| Turks | 99.5 /100 | #72 | Exceptional 95.8% |
| Immigrants | Singapore | 99.5 /100 | #73 | Exceptional 95.8% |
| Thais | 99.5 /100 | #74 | Exceptional 95.8% |
| Inupiat | 99.5 /100 | #75 | Exceptional 95.8% |
| Immigrants | Sweden | 99.5 /100 | #76 | Exceptional 95.8% |
| Whites/Caucasians | 99.4 /100 | #77 | Exceptional 95.8% |
| Immigrants | South Africa | 99.4 /100 | #78 | Exceptional 95.8% |
| Romanians | 99.3 /100 | #79 | Exceptional 95.7% |
| Bhutanese | 99.3 /100 | #80 | Exceptional 95.7% |
| Arapaho | 99.3 /100 | #81 | Exceptional 95.7% |
| Puget Sound Salish | 99.2 /100 | #82 | Exceptional 95.7% |
| Swiss | 99.2 /100 | #83 | Exceptional 95.7% |
| Immigrants | Denmark | 99.1 /100 | #84 | Exceptional 95.7% |
Demographics Similar to Bahamians by 9th Grade
In terms of 9th grade, the demographic groups most similar to Bahamians are Immigrants from Asia (94.4%, a difference of 0.020%), Immigrants from Eastern Africa (94.5%, a difference of 0.030%), Tongan (94.4%, a difference of 0.030%), Indian (Asian) (94.5%, a difference of 0.040%), and Portuguese (94.5%, a difference of 0.050%).
| Demographics | Rating | Rank | 9th Grade |
| Immigrants | Western Asia | 10.7 /100 | #216 | Poor 94.5% |
| Asians | 9.9 /100 | #217 | Tragic 94.5% |
| Portuguese | 9.2 /100 | #218 | Tragic 94.5% |
| Africans | 9.0 /100 | #219 | Tragic 94.5% |
| Indians (Asian) | 8.6 /100 | #220 | Tragic 94.5% |
| Immigrants | Eastern Africa | 8.2 /100 | #221 | Tragic 94.5% |
| Immigrants | Asia | 7.7 /100 | #222 | Tragic 94.4% |
| Bahamians | 7.0 /100 | #223 | Tragic 94.4% |
| Tongans | 6.0 /100 | #224 | Tragic 94.4% |
| Ethiopians | 5.4 /100 | #225 | Tragic 94.4% |
| Sub-Saharan Africans | 5.4 /100 | #226 | Tragic 94.4% |
| Immigrants | Sierra Leone | 4.8 /100 | #227 | Tragic 94.4% |
| Lumbee | 4.7 /100 | #228 | Tragic 94.4% |
| Immigrants | Southern Europe | 4.5 /100 | #229 | Tragic 94.3% |
| Apache | 4.2 /100 | #230 | Tragic 94.3% |