Welsh vs Malaysian Doctorate Degree
COMPARE
Welsh
Malaysian
Doctorate Degree
Doctorate Degree Comparison
Welsh
Malaysians
1.9%
DOCTORATE DEGREE
69.7/ 100
METRIC RATING
160th/ 347
METRIC RANK
1.5%
DOCTORATE DEGREE
0.3/ 100
METRIC RATING
285th/ 347
METRIC RANK
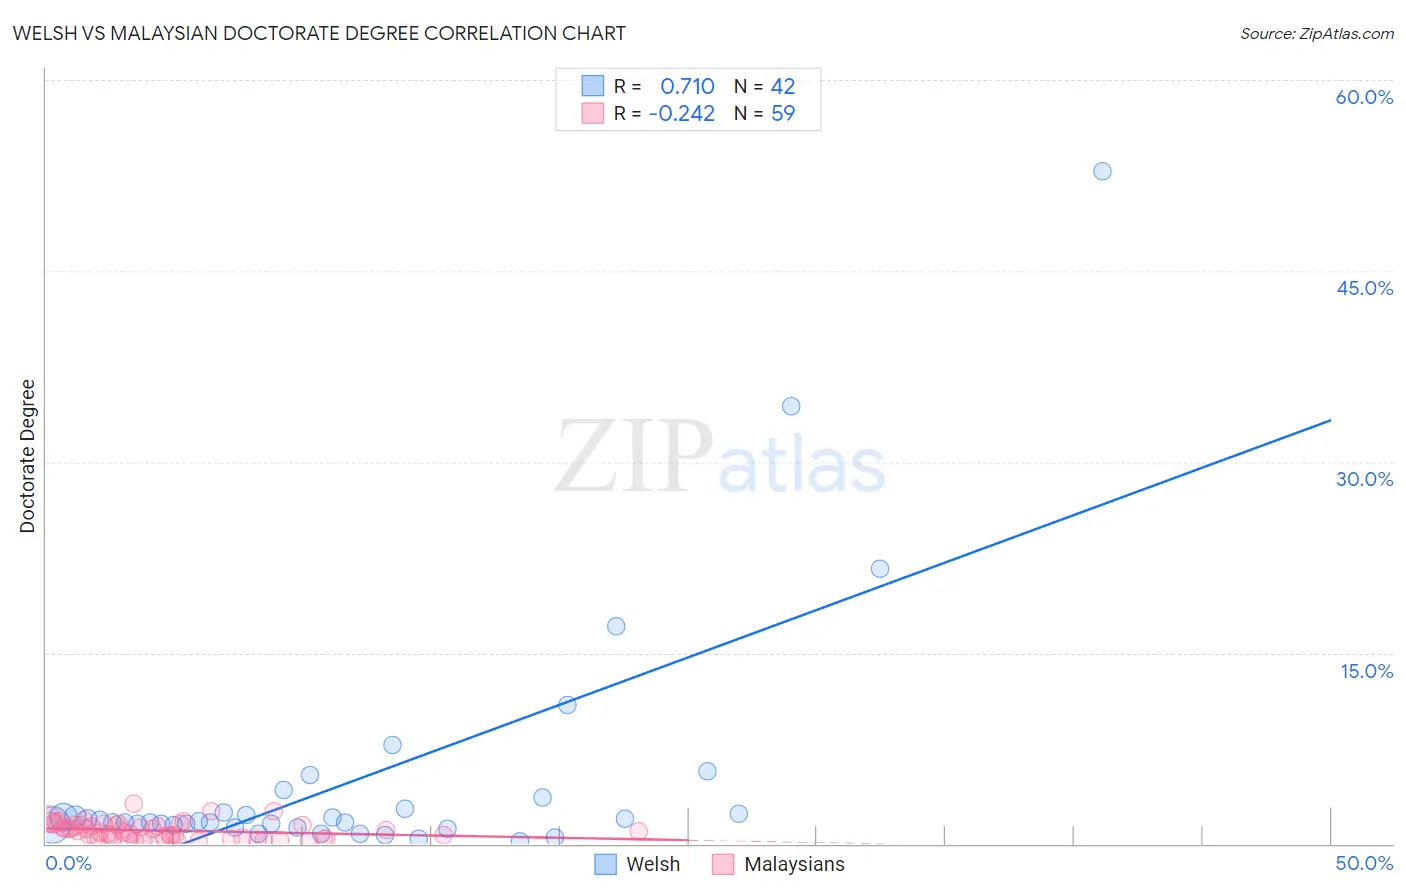
Welsh vs Malaysian Doctorate Degree Correlation Chart
The statistical analysis conducted on geographies consisting of 512,102,106 people shows a strong positive correlation between the proportion of Welsh and percentage of population with at least doctorate degree education in the United States with a correlation coefficient (R) of 0.710 and weighted average of 1.9%. Similarly, the statistical analysis conducted on geographies consisting of 224,756,978 people shows a weak negative correlation between the proportion of Malaysians and percentage of population with at least doctorate degree education in the United States with a correlation coefficient (R) of -0.242 and weighted average of 1.5%, a difference of 30.2%.
Doctorate Degree Correlation Summary
| Measurement | Welsh | Malaysian |
| Minimum | 0.21% | 0.16% |
| Maximum | 52.8% | 3.1% |
| Range | 52.6% | 3.0% |
| Mean | 5.1% | 1.0% |
| Median | 1.7% | 1.00% |
| Interquartile 25% (IQ1) | 1.5% | 0.45% |
| Interquartile 75% (IQ3) | 2.7% | 1.5% |
| Interquartile Range (IQR) | 1.2% | 1.0% |
| Standard Deviation (Sample) | 9.9% | 0.65% |
| Standard Deviation (Population) | 9.8% | 0.64% |
Similar Demographics by Doctorate Degree
Demographics Similar to Welsh by Doctorate Degree
In terms of doctorate degree, the demographic groups most similar to Welsh are Slovene (1.9%, a difference of 0.090%), Immigrants from Middle Africa (1.9%, a difference of 0.15%), Hungarian (1.9%, a difference of 0.35%), Irish (1.9%, a difference of 0.36%), and Danish (1.9%, a difference of 0.38%).
| Demographics | Rating | Rank | Doctorate Degree |
| Immigrants | Oceania | 74.0 /100 | #153 | Good 1.9% |
| Immigrants | Albania | 72.8 /100 | #154 | Good 1.9% |
| Poles | 72.7 /100 | #155 | Good 1.9% |
| Slavs | 72.4 /100 | #156 | Good 1.9% |
| Danes | 71.9 /100 | #157 | Good 1.9% |
| Hungarians | 71.7 /100 | #158 | Good 1.9% |
| Slovenes | 70.2 /100 | #159 | Good 1.9% |
| Welsh | 69.7 /100 | #160 | Good 1.9% |
| Immigrants | Middle Africa | 68.8 /100 | #161 | Good 1.9% |
| Irish | 67.5 /100 | #162 | Good 1.9% |
| Czechs | 67.3 /100 | #163 | Good 1.9% |
| Celtics | 66.7 /100 | #164 | Good 1.9% |
| Scotch-Irish | 63.6 /100 | #165 | Good 1.9% |
| Spaniards | 63.5 /100 | #166 | Good 1.9% |
| Macedonians | 60.9 /100 | #167 | Good 1.9% |
Demographics Similar to Malaysians by Doctorate Degree
In terms of doctorate degree, the demographic groups most similar to Malaysians are Jamaican (1.5%, a difference of 0.030%), Central American (1.5%, a difference of 0.070%), British West Indian (1.5%, a difference of 0.11%), Tohono O'odham (1.5%, a difference of 0.17%), and Cherokee (1.5%, a difference of 0.18%).
| Demographics | Rating | Rank | Doctorate Degree |
| Hawaiians | 0.4 /100 | #278 | Tragic 1.5% |
| Marshallese | 0.4 /100 | #279 | Tragic 1.5% |
| Ecuadorians | 0.4 /100 | #280 | Tragic 1.5% |
| Tohono O'odham | 0.4 /100 | #281 | Tragic 1.5% |
| British West Indians | 0.3 /100 | #282 | Tragic 1.5% |
| Central Americans | 0.3 /100 | #283 | Tragic 1.5% |
| Jamaicans | 0.3 /100 | #284 | Tragic 1.5% |
| Malaysians | 0.3 /100 | #285 | Tragic 1.5% |
| Cherokee | 0.3 /100 | #286 | Tragic 1.5% |
| Cajuns | 0.3 /100 | #287 | Tragic 1.5% |
| Immigrants | El Salvador | 0.3 /100 | #288 | Tragic 1.4% |
| Cape Verdeans | 0.3 /100 | #289 | Tragic 1.4% |
| Choctaw | 0.3 /100 | #290 | Tragic 1.4% |
| Blacks/African Americans | 0.3 /100 | #291 | Tragic 1.4% |
| Alaska Natives | 0.3 /100 | #292 | Tragic 1.4% |