Welsh vs Immigrants from Caribbean Doctorate Degree
COMPARE
Welsh
Immigrants from Caribbean
Doctorate Degree
Doctorate Degree Comparison
Welsh
Immigrants from Caribbean
1.9%
DOCTORATE DEGREE
69.7/ 100
METRIC RATING
160th/ 347
METRIC RANK
1.3%
DOCTORATE DEGREE
0.0/ 100
METRIC RATING
333rd/ 347
METRIC RANK
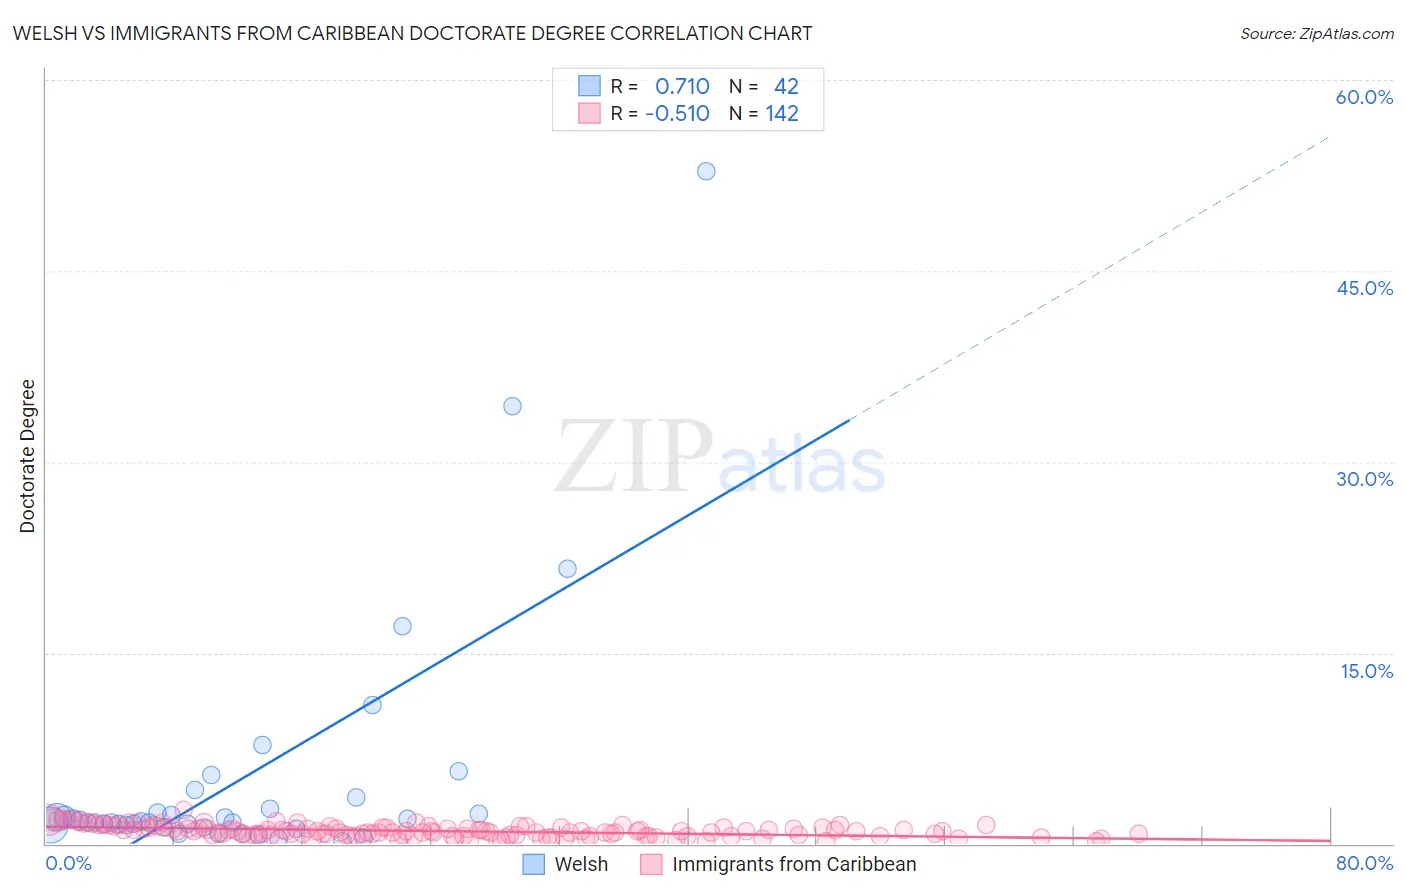
Welsh vs Immigrants from Caribbean Doctorate Degree Correlation Chart
The statistical analysis conducted on geographies consisting of 512,102,106 people shows a strong positive correlation between the proportion of Welsh and percentage of population with at least doctorate degree education in the United States with a correlation coefficient (R) of 0.710 and weighted average of 1.9%. Similarly, the statistical analysis conducted on geographies consisting of 443,887,060 people shows a substantial negative correlation between the proportion of Immigrants from Caribbean and percentage of population with at least doctorate degree education in the United States with a correlation coefficient (R) of -0.510 and weighted average of 1.3%, a difference of 47.9%.
Doctorate Degree Correlation Summary
| Measurement | Welsh | Immigrants from Caribbean |
| Minimum | 0.21% | 0.18% |
| Maximum | 52.8% | 2.6% |
| Range | 52.6% | 2.5% |
| Mean | 5.1% | 1.00% |
| Median | 1.7% | 0.96% |
| Interquartile 25% (IQ1) | 1.5% | 0.67% |
| Interquartile 75% (IQ3) | 2.7% | 1.3% |
| Interquartile Range (IQR) | 1.2% | 0.61% |
| Standard Deviation (Sample) | 9.9% | 0.44% |
| Standard Deviation (Population) | 9.8% | 0.44% |
Similar Demographics by Doctorate Degree
Demographics Similar to Welsh by Doctorate Degree
In terms of doctorate degree, the demographic groups most similar to Welsh are Slovene (1.9%, a difference of 0.090%), Immigrants from Middle Africa (1.9%, a difference of 0.15%), Hungarian (1.9%, a difference of 0.35%), Irish (1.9%, a difference of 0.36%), and Danish (1.9%, a difference of 0.38%).
| Demographics | Rating | Rank | Doctorate Degree |
| Immigrants | Oceania | 74.0 /100 | #153 | Good 1.9% |
| Immigrants | Albania | 72.8 /100 | #154 | Good 1.9% |
| Poles | 72.7 /100 | #155 | Good 1.9% |
| Slavs | 72.4 /100 | #156 | Good 1.9% |
| Danes | 71.9 /100 | #157 | Good 1.9% |
| Hungarians | 71.7 /100 | #158 | Good 1.9% |
| Slovenes | 70.2 /100 | #159 | Good 1.9% |
| Welsh | 69.7 /100 | #160 | Good 1.9% |
| Immigrants | Middle Africa | 68.8 /100 | #161 | Good 1.9% |
| Irish | 67.5 /100 | #162 | Good 1.9% |
| Czechs | 67.3 /100 | #163 | Good 1.9% |
| Celtics | 66.7 /100 | #164 | Good 1.9% |
| Scotch-Irish | 63.6 /100 | #165 | Good 1.9% |
| Spaniards | 63.5 /100 | #166 | Good 1.9% |
| Macedonians | 60.9 /100 | #167 | Good 1.9% |
Demographics Similar to Immigrants from Caribbean by Doctorate Degree
In terms of doctorate degree, the demographic groups most similar to Immigrants from Caribbean are Yakama (1.3%, a difference of 0.16%), Immigrants from Dominican Republic (1.3%, a difference of 0.19%), Immigrants from Latin America (1.3%, a difference of 1.7%), Yup'ik (1.3%, a difference of 1.8%), and Haitian (1.3%, a difference of 2.0%).
| Demographics | Rating | Rank | Doctorate Degree |
| Immigrants | Cabo Verde | 0.0 /100 | #326 | Tragic 1.3% |
| Hispanics or Latinos | 0.0 /100 | #327 | Tragic 1.3% |
| Inupiat | 0.0 /100 | #328 | Tragic 1.3% |
| Haitians | 0.0 /100 | #329 | Tragic 1.3% |
| Yup'ik | 0.0 /100 | #330 | Tragic 1.3% |
| Immigrants | Latin America | 0.0 /100 | #331 | Tragic 1.3% |
| Yakama | 0.0 /100 | #332 | Tragic 1.3% |
| Immigrants | Caribbean | 0.0 /100 | #333 | Tragic 1.3% |
| Immigrants | Dominican Republic | 0.0 /100 | #334 | Tragic 1.3% |
| Immigrants | Haiti | 0.0 /100 | #335 | Tragic 1.3% |
| Nepalese | 0.0 /100 | #336 | Tragic 1.3% |
| Bangladeshis | 0.0 /100 | #337 | Tragic 1.2% |
| Puget Sound Salish | 0.0 /100 | #338 | Tragic 1.2% |
| Immigrants | Central America | 0.0 /100 | #339 | Tragic 1.2% |
| Immigrants | Cuba | 0.0 /100 | #340 | Tragic 1.2% |