Welsh vs West Indian 7th Grade
COMPARE
Welsh
West Indian
7th Grade
7th Grade Comparison
Welsh
West Indians
97.4%
7TH GRADE
100.0/ 100
METRIC RATING
24th/ 347
METRIC RANK
95.2%
7TH GRADE
0.5/ 100
METRIC RATING
263rd/ 347
METRIC RANK
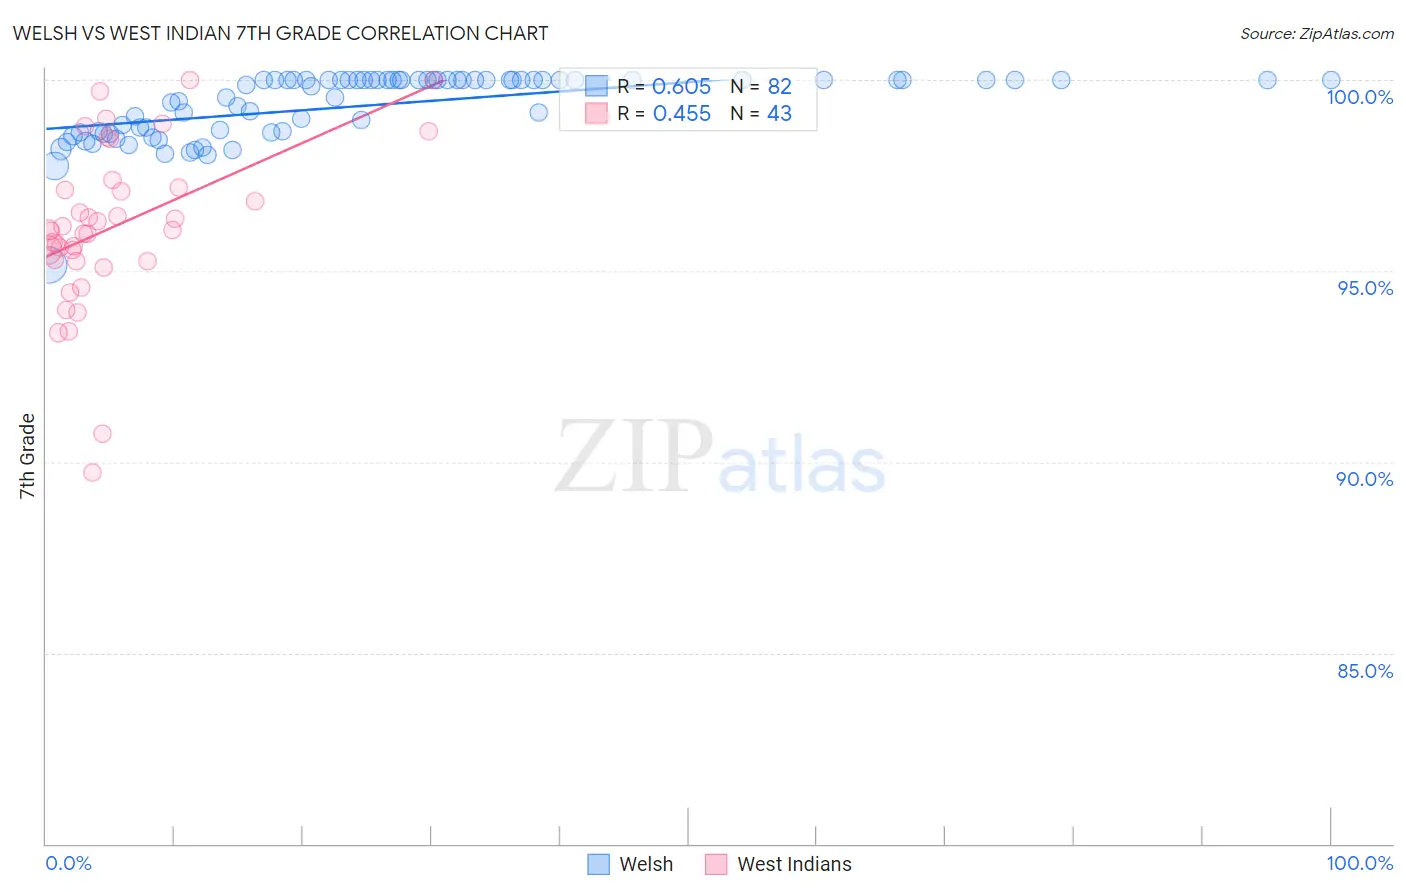
Welsh vs West Indian 7th Grade Correlation Chart
The statistical analysis conducted on geographies consisting of 528,593,557 people shows a significant positive correlation between the proportion of Welsh and percentage of population with at least 7th grade education in the United States with a correlation coefficient (R) of 0.605 and weighted average of 97.4%. Similarly, the statistical analysis conducted on geographies consisting of 254,059,006 people shows a moderate positive correlation between the proportion of West Indians and percentage of population with at least 7th grade education in the United States with a correlation coefficient (R) of 0.455 and weighted average of 95.2%, a difference of 2.3%.
7th Grade Correlation Summary
| Measurement | Welsh | West Indian |
| Minimum | 95.2% | 89.7% |
| Maximum | 100.0% | 100.0% |
| Range | 4.8% | 10.3% |
| Mean | 99.3% | 96.2% |
| Median | 100.0% | 96.1% |
| Interquartile 25% (IQ1) | 98.6% | 95.3% |
| Interquartile 75% (IQ3) | 100.0% | 97.2% |
| Interquartile Range (IQR) | 1.4% | 1.9% |
| Standard Deviation (Sample) | 0.87% | 2.1% |
| Standard Deviation (Population) | 0.86% | 2.1% |
Similar Demographics by 7th Grade
Demographics Similar to Welsh by 7th Grade
In terms of 7th grade, the demographic groups most similar to Welsh are French (97.4%, a difference of 0.0%), Croatian (97.4%, a difference of 0.010%), Scotch-Irish (97.4%, a difference of 0.010%), Danish (97.4%, a difference of 0.010%), and Inupiat (97.4%, a difference of 0.030%).
| Demographics | Rating | Rank | 7th Grade |
| Scottish | 100.0 /100 | #17 | Exceptional 97.5% |
| Tlingit-Haida | 100.0 /100 | #18 | Exceptional 97.5% |
| Lithuanians | 100.0 /100 | #19 | Exceptional 97.5% |
| Yup'ik | 100.0 /100 | #20 | Exceptional 97.4% |
| Inupiat | 100.0 /100 | #21 | Exceptional 97.4% |
| French Canadians | 100.0 /100 | #22 | Exceptional 97.4% |
| Croatians | 100.0 /100 | #23 | Exceptional 97.4% |
| Welsh | 100.0 /100 | #24 | Exceptional 97.4% |
| French | 100.0 /100 | #25 | Exceptional 97.4% |
| Scotch-Irish | 100.0 /100 | #26 | Exceptional 97.4% |
| Danes | 100.0 /100 | #27 | Exceptional 97.4% |
| Sioux | 100.0 /100 | #28 | Exceptional 97.4% |
| Scandinavians | 100.0 /100 | #29 | Exceptional 97.4% |
| Czechs | 100.0 /100 | #30 | Exceptional 97.4% |
| Europeans | 100.0 /100 | #31 | Exceptional 97.3% |
Demographics Similar to West Indians by 7th Grade
In terms of 7th grade, the demographic groups most similar to West Indians are South American (95.2%, a difference of 0.0%), Immigrants from Somalia (95.2%, a difference of 0.0%), Afghan (95.3%, a difference of 0.010%), Immigrants from Nigeria (95.2%, a difference of 0.010%), and Immigrants from Costa Rica (95.3%, a difference of 0.040%).
| Demographics | Rating | Rank | 7th Grade |
| Immigrants | China | 0.7 /100 | #256 | Tragic 95.3% |
| Immigrants | Congo | 0.7 /100 | #257 | Tragic 95.3% |
| Ghanaians | 0.7 /100 | #258 | Tragic 95.3% |
| Immigrants | Costa Rica | 0.6 /100 | #259 | Tragic 95.3% |
| Afghans | 0.5 /100 | #260 | Tragic 95.3% |
| South Americans | 0.5 /100 | #261 | Tragic 95.2% |
| Immigrants | Somalia | 0.5 /100 | #262 | Tragic 95.2% |
| West Indians | 0.5 /100 | #263 | Tragic 95.2% |
| Immigrants | Nigeria | 0.4 /100 | #264 | Tragic 95.2% |
| Immigrants | Uruguay | 0.3 /100 | #265 | Tragic 95.2% |
| Immigrants | Ghana | 0.3 /100 | #266 | Tragic 95.2% |
| Yuman | 0.3 /100 | #267 | Tragic 95.2% |
| Immigrants | Hong Kong | 0.3 /100 | #268 | Tragic 95.2% |
| Trinidadians and Tobagonians | 0.3 /100 | #269 | Tragic 95.2% |
| Houma | 0.2 /100 | #270 | Tragic 95.1% |