Welsh vs West Indian Disability Age 18 to 34
COMPARE
Welsh
West Indian
Disability Age 18 to 34
Disability Age 18 to 34 Comparison
Welsh
West Indians
7.7%
DISABILITY AGE 18 TO 34
0.0/ 100
METRIC RATING
302nd/ 347
METRIC RANK
6.3%
DISABILITY AGE 18 TO 34
92.0/ 100
METRIC RATING
127th/ 347
METRIC RANK
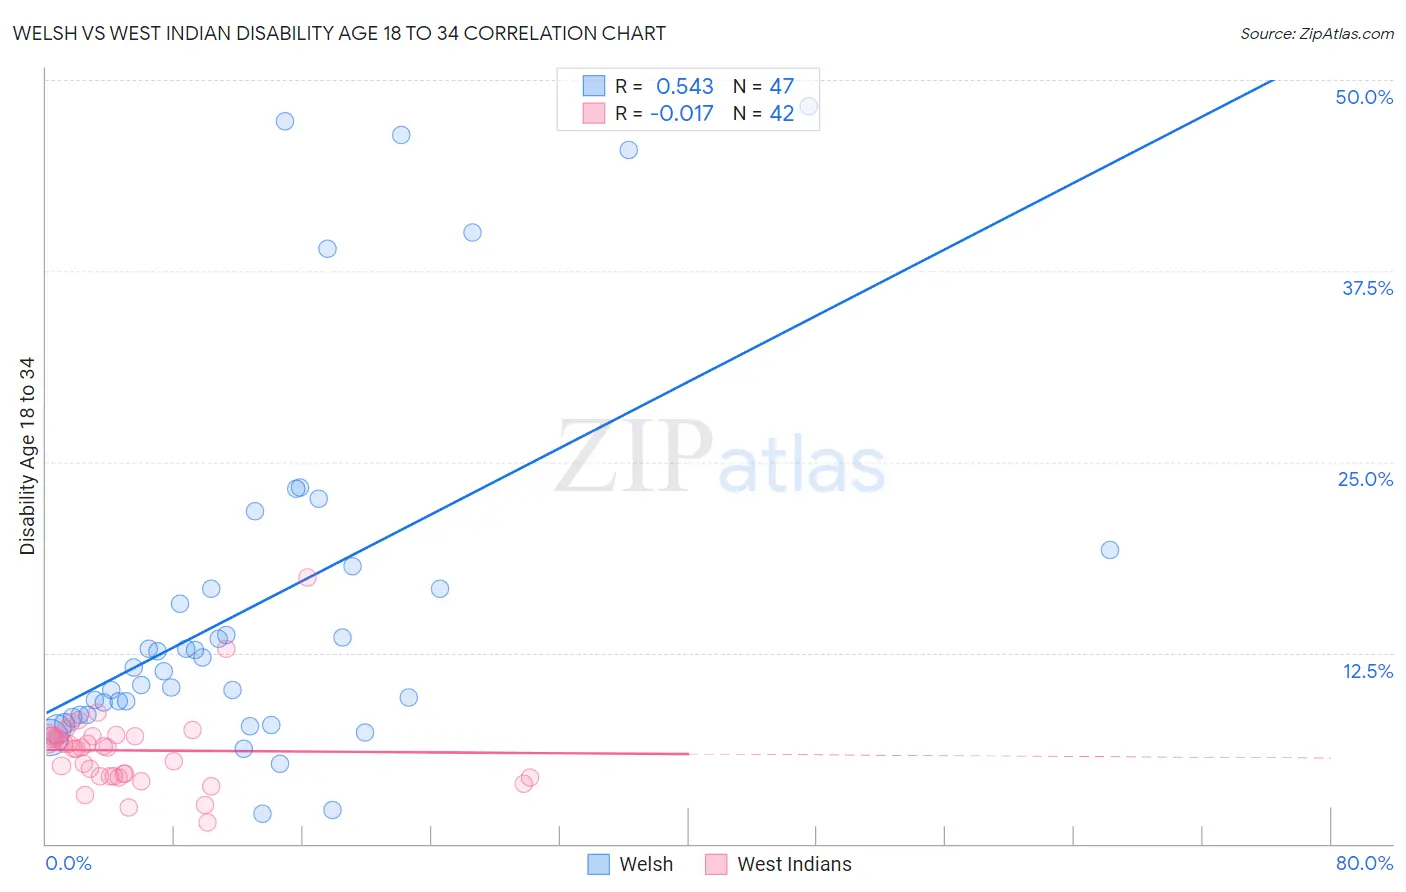
Welsh vs West Indian Disability Age 18 to 34 Correlation Chart
The statistical analysis conducted on geographies consisting of 524,899,929 people shows a substantial positive correlation between the proportion of Welsh and percentage of population with a disability between the ages 18 and 35 in the United States with a correlation coefficient (R) of 0.543 and weighted average of 7.7%. Similarly, the statistical analysis conducted on geographies consisting of 253,877,973 people shows no correlation between the proportion of West Indians and percentage of population with a disability between the ages 18 and 35 in the United States with a correlation coefficient (R) of -0.017 and weighted average of 6.3%, a difference of 22.5%.
Disability Age 18 to 34 Correlation Summary
| Measurement | Welsh | West Indian |
| Minimum | 1.9% | 1.4% |
| Maximum | 48.3% | 17.4% |
| Range | 46.3% | 16.0% |
| Mean | 15.8% | 6.1% |
| Median | 11.6% | 6.3% |
| Interquartile 25% (IQ1) | 8.5% | 4.4% |
| Interquartile 75% (IQ3) | 18.2% | 7.0% |
| Interquartile Range (IQR) | 9.7% | 2.6% |
| Standard Deviation (Sample) | 12.2% | 2.7% |
| Standard Deviation (Population) | 12.0% | 2.6% |
Similar Demographics by Disability Age 18 to 34
Demographics Similar to Welsh by Disability Age 18 to 34
In terms of disability age 18 to 34, the demographic groups most similar to Welsh are Cheyenne (7.7%, a difference of 0.060%), Pima (7.7%, a difference of 0.070%), Scottish (7.7%, a difference of 0.14%), German (7.7%, a difference of 0.15%), and Dutch (7.7%, a difference of 0.39%).
| Demographics | Rating | Rank | Disability Age 18 to 34 |
| Tlingit-Haida | 0.0 /100 | #295 | Tragic 7.7% |
| Cape Verdeans | 0.0 /100 | #296 | Tragic 7.7% |
| Pueblo | 0.0 /100 | #297 | Tragic 7.7% |
| Dutch | 0.0 /100 | #298 | Tragic 7.7% |
| Germans | 0.0 /100 | #299 | Tragic 7.7% |
| Scottish | 0.0 /100 | #300 | Tragic 7.7% |
| Pima | 0.0 /100 | #301 | Tragic 7.7% |
| Welsh | 0.0 /100 | #302 | Tragic 7.7% |
| Cheyenne | 0.0 /100 | #303 | Tragic 7.7% |
| Shoshone | 0.0 /100 | #304 | Tragic 7.8% |
| Menominee | 0.0 /100 | #305 | Tragic 7.8% |
| English | 0.0 /100 | #306 | Tragic 7.8% |
| Scotch-Irish | 0.0 /100 | #307 | Tragic 7.8% |
| Pennsylvania Germans | 0.0 /100 | #308 | Tragic 7.8% |
| Alaska Natives | 0.0 /100 | #309 | Tragic 7.8% |
Demographics Similar to West Indians by Disability Age 18 to 34
In terms of disability age 18 to 34, the demographic groups most similar to West Indians are Chinese (6.3%, a difference of 0.010%), Immigrants from Switzerland (6.3%, a difference of 0.14%), Macedonian (6.3%, a difference of 0.16%), Immigrants from Morocco (6.3%, a difference of 0.23%), and Costa Rican (6.3%, a difference of 0.25%).
| Demographics | Rating | Rank | Disability Age 18 to 34 |
| Immigrants | Ukraine | 93.4 /100 | #120 | Exceptional 6.3% |
| Immigrants | Guatemala | 93.4 /100 | #121 | Exceptional 6.3% |
| Immigrants | Czechoslovakia | 93.3 /100 | #122 | Exceptional 6.3% |
| Costa Ricans | 92.9 /100 | #123 | Exceptional 6.3% |
| Immigrants | Morocco | 92.9 /100 | #124 | Exceptional 6.3% |
| Macedonians | 92.6 /100 | #125 | Exceptional 6.3% |
| Immigrants | Switzerland | 92.5 /100 | #126 | Exceptional 6.3% |
| West Indians | 92.0 /100 | #127 | Exceptional 6.3% |
| Chinese | 91.9 /100 | #128 | Exceptional 6.3% |
| Immigrants | Italy | 90.5 /100 | #129 | Exceptional 6.3% |
| Immigrants | Dominica | 90.5 /100 | #130 | Exceptional 6.3% |
| Immigrants | Saudi Arabia | 90.4 /100 | #131 | Exceptional 6.3% |
| Guatemalans | 89.6 /100 | #132 | Excellent 6.4% |
| Brazilians | 89.0 /100 | #133 | Excellent 6.4% |
| Immigrants | Europe | 88.8 /100 | #134 | Excellent 6.4% |