Spanish American Indian vs Immigrants from Eritrea Associate's Degree
COMPARE
Spanish American Indian
Immigrants from Eritrea
Associate's Degree
Associate's Degree Comparison
Spanish American Indians
Immigrants from Eritrea
34.9%
ASSOCIATE'S DEGREE
0.0/ 100
METRIC RATING
335th/ 347
METRIC RANK
48.1%
ASSOCIATE'S DEGREE
87.8/ 100
METRIC RATING
137th/ 347
METRIC RANK
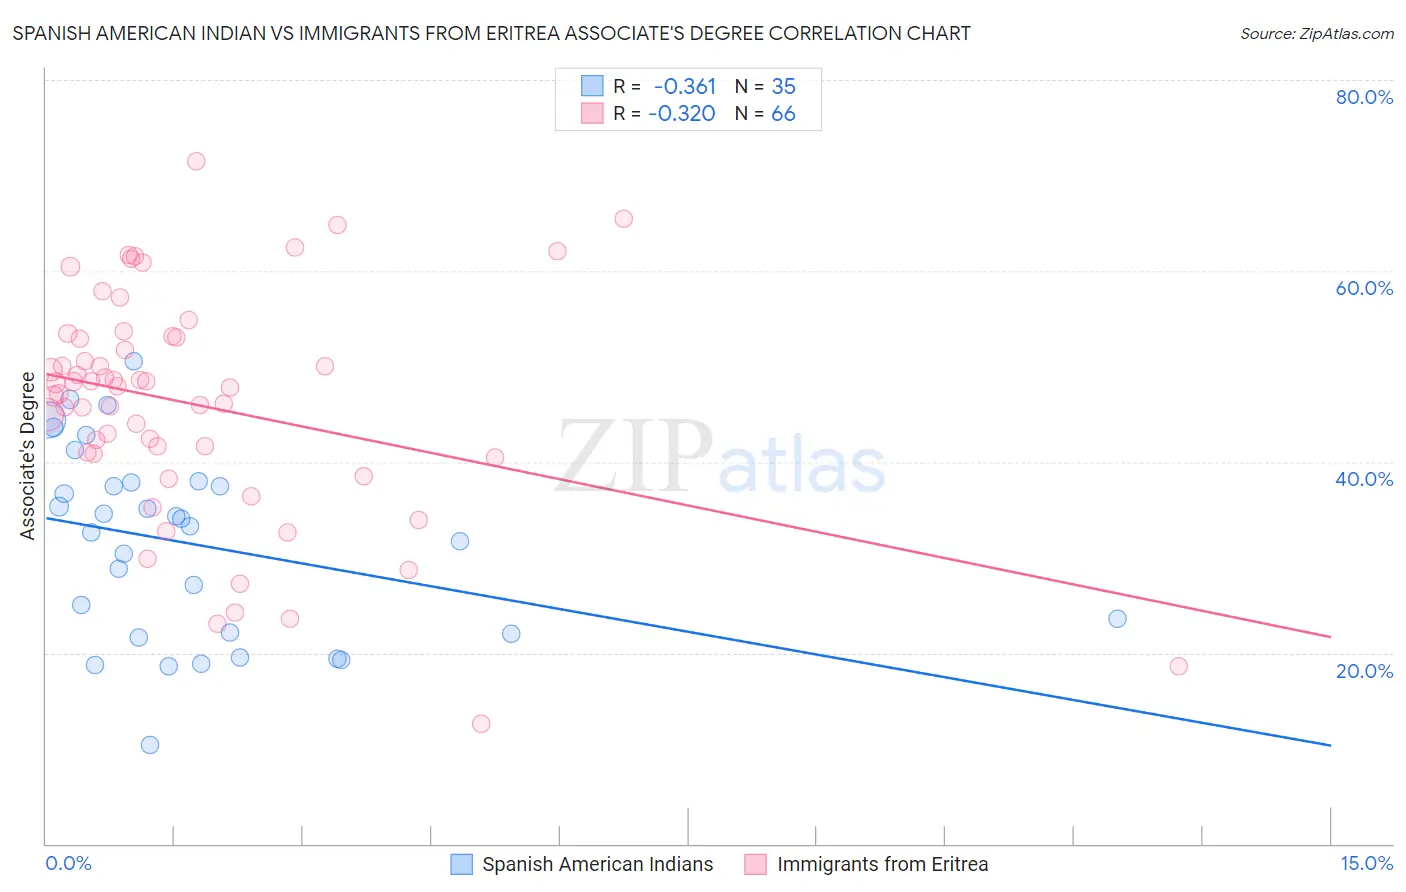
Spanish American Indian vs Immigrants from Eritrea Associate's Degree Correlation Chart
The statistical analysis conducted on geographies consisting of 73,150,359 people shows a mild negative correlation between the proportion of Spanish American Indians and percentage of population with at least associate's degree education in the United States with a correlation coefficient (R) of -0.361 and weighted average of 34.9%. Similarly, the statistical analysis conducted on geographies consisting of 104,852,788 people shows a mild negative correlation between the proportion of Immigrants from Eritrea and percentage of population with at least associate's degree education in the United States with a correlation coefficient (R) of -0.320 and weighted average of 48.1%, a difference of 37.9%.
Associate's Degree Correlation Summary
| Measurement | Spanish American Indian | Immigrants from Eritrea |
| Minimum | 10.3% | 12.6% |
| Maximum | 50.6% | 71.5% |
| Range | 40.3% | 58.9% |
| Mean | 31.4% | 46.0% |
| Median | 33.2% | 47.9% |
| Interquartile 25% (IQ1) | 22.0% | 40.9% |
| Interquartile 75% (IQ3) | 37.9% | 53.1% |
| Interquartile Range (IQR) | 15.8% | 12.2% |
| Standard Deviation (Sample) | 9.9% | 11.9% |
| Standard Deviation (Population) | 9.8% | 11.8% |
Similar Demographics by Associate's Degree
Demographics Similar to Spanish American Indians by Associate's Degree
In terms of associate's degree, the demographic groups most similar to Spanish American Indians are Native/Alaskan (34.9%, a difference of 0.14%), Mexican (35.0%, a difference of 0.37%), Immigrants from Central America (35.0%, a difference of 0.45%), Hopi (34.6%, a difference of 0.88%), and Lumbee (34.1%, a difference of 2.2%).
| Demographics | Rating | Rank | Associate's Degree |
| Alaskan Athabascans | 0.0 /100 | #328 | Tragic 36.5% |
| Paiute | 0.0 /100 | #329 | Tragic 36.4% |
| Apache | 0.0 /100 | #330 | Tragic 36.2% |
| Immigrants | Azores | 0.0 /100 | #331 | Tragic 35.6% |
| Immigrants | Central America | 0.0 /100 | #332 | Tragic 35.0% |
| Mexicans | 0.0 /100 | #333 | Tragic 35.0% |
| Natives/Alaskans | 0.0 /100 | #334 | Tragic 34.9% |
| Spanish American Indians | 0.0 /100 | #335 | Tragic 34.9% |
| Hopi | 0.0 /100 | #336 | Tragic 34.6% |
| Lumbee | 0.0 /100 | #337 | Tragic 34.1% |
| Pueblo | 0.0 /100 | #338 | Tragic 34.0% |
| Immigrants | Mexico | 0.0 /100 | #339 | Tragic 33.7% |
| Navajo | 0.0 /100 | #340 | Tragic 32.6% |
| Inupiat | 0.0 /100 | #341 | Tragic 32.6% |
| Yakama | 0.0 /100 | #342 | Tragic 32.3% |
Demographics Similar to Immigrants from Eritrea by Associate's Degree
In terms of associate's degree, the demographic groups most similar to Immigrants from Eritrea are Pakistani (48.1%, a difference of 0.040%), Polish (48.0%, a difference of 0.070%), European (48.2%, a difference of 0.22%), Moroccan (48.2%, a difference of 0.28%), and Assyrian/Chaldean/Syriac (48.2%, a difference of 0.30%).
| Demographics | Rating | Rank | Associate's Degree |
| Immigrants | Jordan | 91.2 /100 | #130 | Exceptional 48.4% |
| Icelanders | 90.8 /100 | #131 | Exceptional 48.3% |
| Immigrants | Albania | 89.9 /100 | #132 | Excellent 48.2% |
| Assyrians/Chaldeans/Syriacs | 89.4 /100 | #133 | Excellent 48.2% |
| Moroccans | 89.3 /100 | #134 | Excellent 48.2% |
| Europeans | 89.0 /100 | #135 | Excellent 48.2% |
| Pakistanis | 88.0 /100 | #136 | Excellent 48.1% |
| Immigrants | Eritrea | 87.8 /100 | #137 | Excellent 48.1% |
| Poles | 87.3 /100 | #138 | Excellent 48.0% |
| Slovenes | 85.1 /100 | #139 | Excellent 47.9% |
| Immigrants | Southern Europe | 84.4 /100 | #140 | Excellent 47.8% |
| Taiwanese | 83.3 /100 | #141 | Excellent 47.7% |
| Sierra Leoneans | 82.9 /100 | #142 | Excellent 47.7% |
| Norwegians | 81.0 /100 | #143 | Excellent 47.6% |
| Slavs | 80.5 /100 | #144 | Excellent 47.6% |