Luxembourger vs Immigrants from Eritrea Associate's Degree
COMPARE
Luxembourger
Immigrants from Eritrea
Associate's Degree
Associate's Degree Comparison
Luxembourgers
Immigrants from Eritrea
48.9%
ASSOCIATE'S DEGREE
95.1/ 100
METRIC RATING
115th/ 347
METRIC RANK
48.1%
ASSOCIATE'S DEGREE
87.8/ 100
METRIC RATING
137th/ 347
METRIC RANK
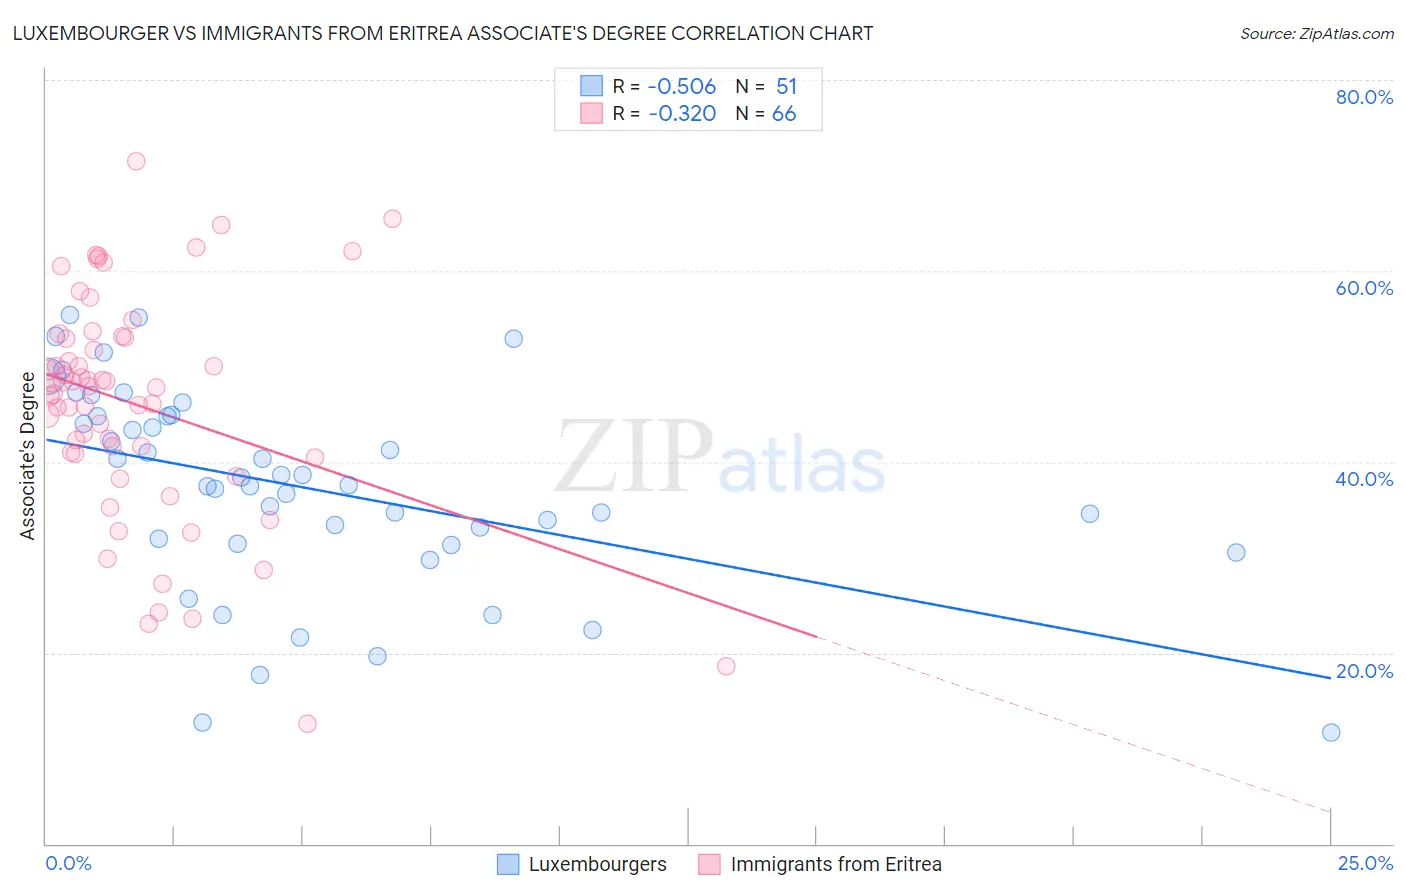
Luxembourger vs Immigrants from Eritrea Associate's Degree Correlation Chart
The statistical analysis conducted on geographies consisting of 144,669,257 people shows a substantial negative correlation between the proportion of Luxembourgers and percentage of population with at least associate's degree education in the United States with a correlation coefficient (R) of -0.506 and weighted average of 48.9%. Similarly, the statistical analysis conducted on geographies consisting of 104,852,788 people shows a mild negative correlation between the proportion of Immigrants from Eritrea and percentage of population with at least associate's degree education in the United States with a correlation coefficient (R) of -0.320 and weighted average of 48.1%, a difference of 1.8%.
Associate's Degree Correlation Summary
| Measurement | Luxembourger | Immigrants from Eritrea |
| Minimum | 11.7% | 12.6% |
| Maximum | 55.4% | 71.5% |
| Range | 43.7% | 58.9% |
| Mean | 37.3% | 46.0% |
| Median | 37.6% | 47.9% |
| Interquartile 25% (IQ1) | 31.5% | 40.9% |
| Interquartile 75% (IQ3) | 44.8% | 53.1% |
| Interquartile Range (IQR) | 13.3% | 12.2% |
| Standard Deviation (Sample) | 10.5% | 11.9% |
| Standard Deviation (Population) | 10.4% | 11.8% |
Similar Demographics by Associate's Degree
Demographics Similar to Luxembourgers by Associate's Degree
In terms of associate's degree, the demographic groups most similar to Luxembourgers are Immigrants from Chile (49.0%, a difference of 0.070%), Palestinian (49.0%, a difference of 0.070%), Arab (49.0%, a difference of 0.070%), British (48.9%, a difference of 0.070%), and Afghan (48.9%, a difference of 0.11%).
| Demographics | Rating | Rank | Associate's Degree |
| Jordanians | 96.6 /100 | #108 | Exceptional 49.2% |
| Immigrants | Morocco | 96.3 /100 | #109 | Exceptional 49.2% |
| Austrians | 95.8 /100 | #110 | Exceptional 49.1% |
| Immigrants | Venezuela | 95.8 /100 | #111 | Exceptional 49.1% |
| Immigrants | Chile | 95.3 /100 | #112 | Exceptional 49.0% |
| Palestinians | 95.3 /100 | #113 | Exceptional 49.0% |
| Arabs | 95.3 /100 | #114 | Exceptional 49.0% |
| Luxembourgers | 95.1 /100 | #115 | Exceptional 48.9% |
| British | 95.0 /100 | #116 | Exceptional 48.9% |
| Afghans | 94.8 /100 | #117 | Exceptional 48.9% |
| Albanians | 94.7 /100 | #118 | Exceptional 48.8% |
| Lebanese | 94.6 /100 | #119 | Exceptional 48.8% |
| Alsatians | 94.6 /100 | #120 | Exceptional 48.8% |
| Ugandans | 93.9 /100 | #121 | Exceptional 48.7% |
| Italians | 93.9 /100 | #122 | Exceptional 48.7% |
Demographics Similar to Immigrants from Eritrea by Associate's Degree
In terms of associate's degree, the demographic groups most similar to Immigrants from Eritrea are Pakistani (48.1%, a difference of 0.040%), Polish (48.0%, a difference of 0.070%), European (48.2%, a difference of 0.22%), Moroccan (48.2%, a difference of 0.28%), and Assyrian/Chaldean/Syriac (48.2%, a difference of 0.30%).
| Demographics | Rating | Rank | Associate's Degree |
| Immigrants | Jordan | 91.2 /100 | #130 | Exceptional 48.4% |
| Icelanders | 90.8 /100 | #131 | Exceptional 48.3% |
| Immigrants | Albania | 89.9 /100 | #132 | Excellent 48.2% |
| Assyrians/Chaldeans/Syriacs | 89.4 /100 | #133 | Excellent 48.2% |
| Moroccans | 89.3 /100 | #134 | Excellent 48.2% |
| Europeans | 89.0 /100 | #135 | Excellent 48.2% |
| Pakistanis | 88.0 /100 | #136 | Excellent 48.1% |
| Immigrants | Eritrea | 87.8 /100 | #137 | Excellent 48.1% |
| Poles | 87.3 /100 | #138 | Excellent 48.0% |
| Slovenes | 85.1 /100 | #139 | Excellent 47.9% |
| Immigrants | Southern Europe | 84.4 /100 | #140 | Excellent 47.8% |
| Taiwanese | 83.3 /100 | #141 | Excellent 47.7% |
| Sierra Leoneans | 82.9 /100 | #142 | Excellent 47.7% |
| Norwegians | 81.0 /100 | #143 | Excellent 47.6% |
| Slavs | 80.5 /100 | #144 | Excellent 47.6% |