Bhutanese vs Immigrants from Eritrea Associate's Degree
COMPARE
Bhutanese
Immigrants from Eritrea
Associate's Degree
Associate's Degree Comparison
Bhutanese
Immigrants from Eritrea
51.4%
ASSOCIATE'S DEGREE
99.7/ 100
METRIC RATING
62nd/ 347
METRIC RANK
48.1%
ASSOCIATE'S DEGREE
87.8/ 100
METRIC RATING
137th/ 347
METRIC RANK
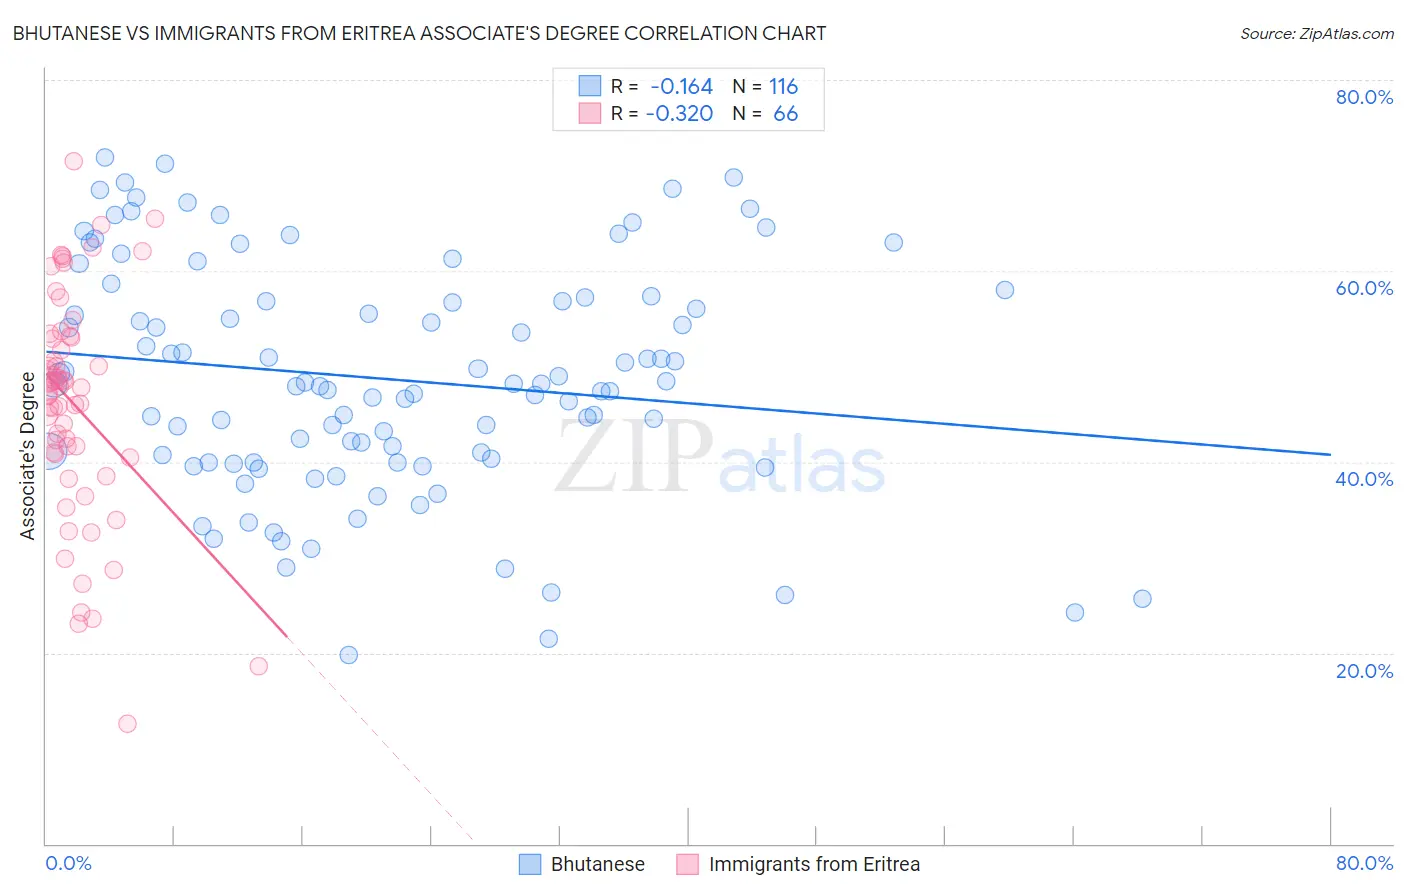
Bhutanese vs Immigrants from Eritrea Associate's Degree Correlation Chart
The statistical analysis conducted on geographies consisting of 455,542,651 people shows a poor negative correlation between the proportion of Bhutanese and percentage of population with at least associate's degree education in the United States with a correlation coefficient (R) of -0.164 and weighted average of 51.4%. Similarly, the statistical analysis conducted on geographies consisting of 104,852,788 people shows a mild negative correlation between the proportion of Immigrants from Eritrea and percentage of population with at least associate's degree education in the United States with a correlation coefficient (R) of -0.320 and weighted average of 48.1%, a difference of 7.0%.
Associate's Degree Correlation Summary
| Measurement | Bhutanese | Immigrants from Eritrea |
| Minimum | 19.7% | 12.6% |
| Maximum | 71.8% | 71.5% |
| Range | 52.1% | 58.9% |
| Mean | 48.7% | 46.0% |
| Median | 48.1% | 47.9% |
| Interquartile 25% (IQ1) | 40.1% | 40.9% |
| Interquartile 75% (IQ3) | 57.0% | 53.1% |
| Interquartile Range (IQR) | 16.9% | 12.2% |
| Standard Deviation (Sample) | 12.0% | 11.9% |
| Standard Deviation (Population) | 12.0% | 11.8% |
Similar Demographics by Associate's Degree
Demographics Similar to Bhutanese by Associate's Degree
In terms of associate's degree, the demographic groups most similar to Bhutanese are Immigrants from Kazakhstan (51.4%, a difference of 0.0%), South African (51.4%, a difference of 0.050%), Immigrants from Netherlands (51.4%, a difference of 0.13%), Immigrants from Bolivia (51.5%, a difference of 0.15%), and Zimbabwean (51.3%, a difference of 0.16%).
| Demographics | Rating | Rank | Associate's Degree |
| Australians | 99.8 /100 | #55 | Exceptional 51.9% |
| Immigrants | Czechoslovakia | 99.8 /100 | #56 | Exceptional 51.9% |
| Paraguayans | 99.8 /100 | #57 | Exceptional 51.8% |
| New Zealanders | 99.8 /100 | #58 | Exceptional 51.8% |
| Immigrants | Serbia | 99.8 /100 | #59 | Exceptional 51.7% |
| Immigrants | Bolivia | 99.7 /100 | #60 | Exceptional 51.5% |
| Immigrants | Kazakhstan | 99.7 /100 | #61 | Exceptional 51.4% |
| Bhutanese | 99.7 /100 | #62 | Exceptional 51.4% |
| South Africans | 99.7 /100 | #63 | Exceptional 51.4% |
| Immigrants | Netherlands | 99.7 /100 | #64 | Exceptional 51.4% |
| Zimbabweans | 99.7 /100 | #65 | Exceptional 51.3% |
| Immigrants | Europe | 99.7 /100 | #66 | Exceptional 51.3% |
| Argentineans | 99.6 /100 | #67 | Exceptional 51.2% |
| Immigrants | Indonesia | 99.5 /100 | #68 | Exceptional 51.0% |
| Egyptians | 99.5 /100 | #69 | Exceptional 50.9% |
Demographics Similar to Immigrants from Eritrea by Associate's Degree
In terms of associate's degree, the demographic groups most similar to Immigrants from Eritrea are Pakistani (48.1%, a difference of 0.040%), Polish (48.0%, a difference of 0.070%), European (48.2%, a difference of 0.22%), Moroccan (48.2%, a difference of 0.28%), and Assyrian/Chaldean/Syriac (48.2%, a difference of 0.30%).
| Demographics | Rating | Rank | Associate's Degree |
| Immigrants | Jordan | 91.2 /100 | #130 | Exceptional 48.4% |
| Icelanders | 90.8 /100 | #131 | Exceptional 48.3% |
| Immigrants | Albania | 89.9 /100 | #132 | Excellent 48.2% |
| Assyrians/Chaldeans/Syriacs | 89.4 /100 | #133 | Excellent 48.2% |
| Moroccans | 89.3 /100 | #134 | Excellent 48.2% |
| Europeans | 89.0 /100 | #135 | Excellent 48.2% |
| Pakistanis | 88.0 /100 | #136 | Excellent 48.1% |
| Immigrants | Eritrea | 87.8 /100 | #137 | Excellent 48.1% |
| Poles | 87.3 /100 | #138 | Excellent 48.0% |
| Slovenes | 85.1 /100 | #139 | Excellent 47.9% |
| Immigrants | Southern Europe | 84.4 /100 | #140 | Excellent 47.8% |
| Taiwanese | 83.3 /100 | #141 | Excellent 47.7% |
| Sierra Leoneans | 82.9 /100 | #142 | Excellent 47.7% |
| Norwegians | 81.0 /100 | #143 | Excellent 47.6% |
| Slavs | 80.5 /100 | #144 | Excellent 47.6% |